Tableau | Data visualisation | Analytics
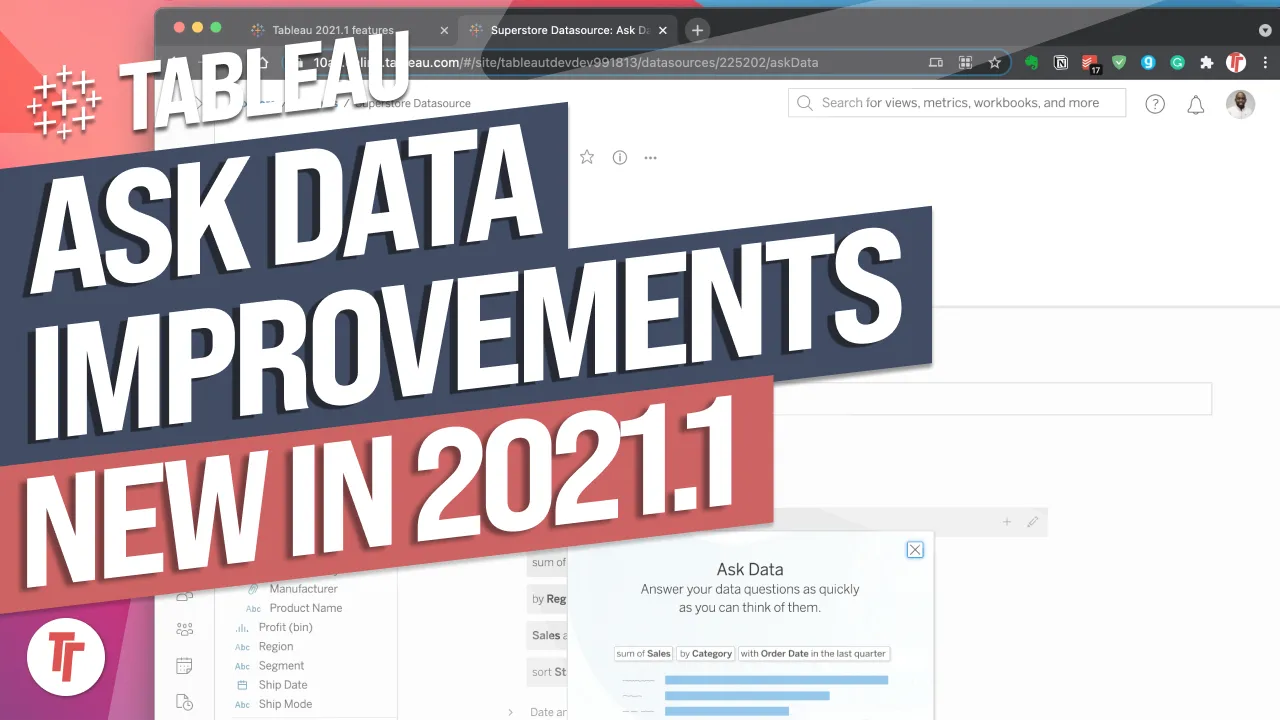
 Tableau 2020.2: Ask data custom suggestions.
Tableau 2020.2 lets you customise Ask Data suggestions, and the first thing I did was delete the pie chart option.
- A new pencil icon in the Ask Data interface lets you customise the suggested questions shown to users
- You can remove suggestions that don't make sense, such as pie chart options or unhelpful default questions
- Editing a suggestion is as simple as typing into the field, with auto-complete helping you build a better prompt like 'sum of sales by region'
- Ask Data breaks a natural language query into simpler component queries automatically
- Customising suggestions helps guide users towards the questions they can usefully ask of a data source
Tableau 2020.2 lets you customise the suggested questions shown in the Ask Data interface, so you can remove poor suggestions and steer users towards questions the data source can actually answer well.
Demonstrated in the Ask Data interface on a standard data source, looking at the default suggestion groups that appear when you open Ask Data.
- Find the pencil icon 0:21
When you open Ask Data on a data source, a pencil icon appears next to each suggestion group. This is the entry point for customising the suggestions shown to users.
- Suggestions are grouped by attribute 0:40
Suggestions are organised into groups such as filters, date and time, and map types, and you can edit or remove entries within each group independently.
- Remove suggestions that don't make sense 1:00
If a suggested chart type or question isn't useful for your data or audience, delete it outright, for example removing a pie chart option you never want users to reach for.
- Edit a suggestion by typing into it 1:23
You can replace an existing suggestion, such as swapping a 'by state' question for 'by region', simply by typing into the field, with auto-complete helping you phrase it correctly.
- Build more specific suggestions 1:42
You can construct fuller prompts like 'sum of sales by region' directly in the field, using auto-complete to guide the phrasing as you type.
- Ask Data decomposes complex queries 2:01
When you run a suggestion, Ask Data automatically breaks it down into simpler component queries behind the scenes to produce the result.
- Take results further or keep browsing 2:02
Once a suggestion returns a view, you can open it in web edit for more work, or close it and keep browsing the data source with Ask Data as normal.
- Auto-complete can be slow to respond depending on your Tableau environment, so typed suggestions may take a moment to catch up.
Reach for this when you're rolling out a data source to less technical users via Ask Data and want to strip out irrelevant chart types or vague default questions so they're guided towards ones that actually work.
How this Rollup was made provenance & method
A Rollup is drafted by AI from the video's transcript, then reviewed and edited by Tim. Everything used to produce this one is listed below (the model, the exact prompt, and the source video), so the process is transparent and reproducible.
- Transcription
- On-device: NVIDIA Parakeet v3 for recent videos, OpenAI Whisper large-v3 for earlier ones. The transcript never leaves the machine or gets published.
- Drafting
- Claude Sonnet 5 in the cloud, from that transcript.
- Prompt
- The exact Rollup prompt (v2) , the full system prompt, unedited.
- Mode
- Walkthrough: a timestamped breakdown in video order, for a demo or how-to. Written before modes existed, when every Rollup was a walkthrough.
- Source video
- Watch on YouTube
- Drafted
- 5 July 2026 at 09:38
- Reviewed & edited
- 5 July 2026 at 09:41 · by Tim Ngwena
Model + prompt + video is everything you'd need to recreate a Rollup like this yourself. The one thing we don't share is the transcript.
Rights. The video and its transcript are the property of TN Media Ltd. Unauthorised use or download is prohibited. © TN Media Ltd.