Tableau | Data visualisation | Analytics
 Ask data phrase builder: New in Tableau 2022.1
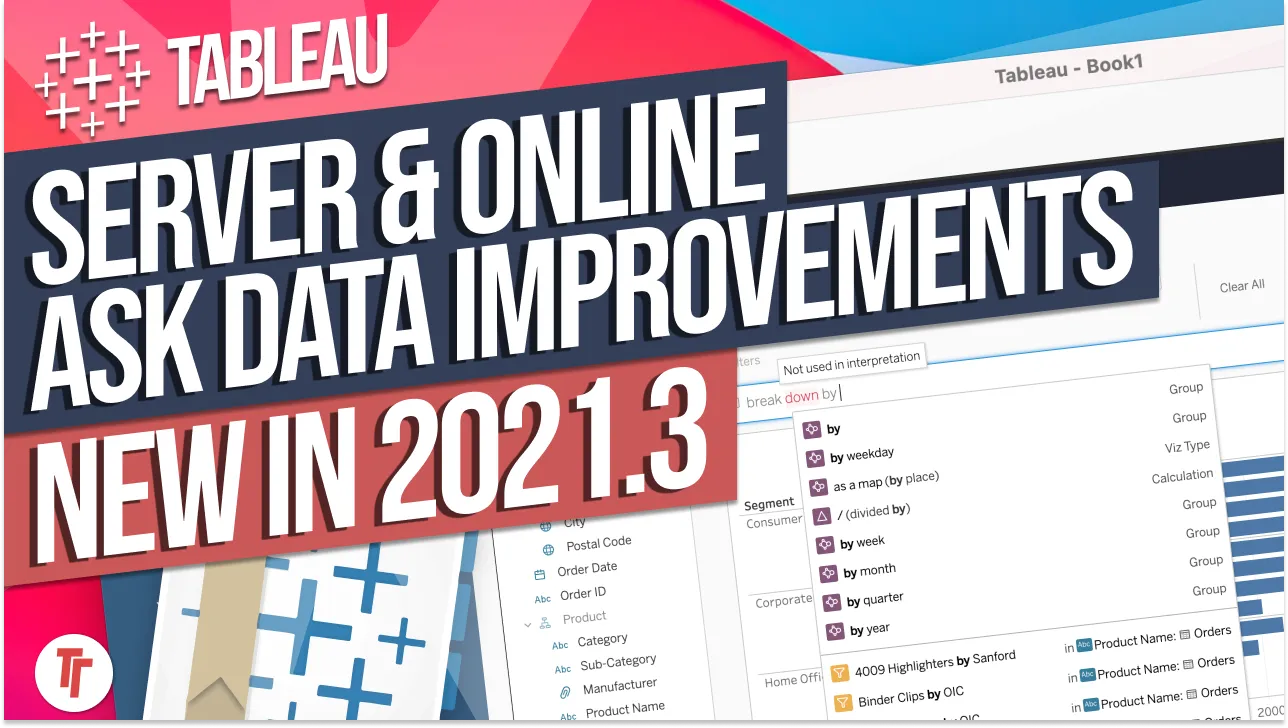
Ask Data's new Phrase Builder lets you build a chart with a few clicks and never type a single question.
- The Phrase Builder lets you ask questions in Ask Data by selecting fields and phrases instead of typing free text
- You still need a lens, which scopes the data available to Ask Data, before you can begin
- Adding a field prompts you for an aggregation (e.g. sum of sales) and progressively builds the chart as you go
- You can swap chart types on the right-hand side and apply filters by selecting field values, such as a specific regional manager
- Ask Data is now available to viewer and explorer licences as well as creators
Tableau's Ask Data Phrase Builder lets you build a question by clicking fields and phrases instead of typing free text, which removes the guesswork of knowing what to type when facing an unfamiliar dataset.
Ask Data previously required typing natural-language questions, which many users found difficult when they didn't know the data. The Phrase Builder replaces typing with a click-driven interface for constructing the same questions.
- Start from a lens 0:21
You must begin from a lens before using Ask Data — a lens scopes which fields and data are available to the Phrase Builder, so it's a prerequisite rather than optional.
- Add a field to start the question 0:41
Instead of typing, you click 'Add field' and pick from the list of available fields; selecting one (e.g. a measure) prompts you to choose an aggregation such as sum, with an advanced option for other variants.
- Chart builds progressively as you add fields 1:02
Each field you add continues the line of inquiry and updates the chart automatically — for example adding a category field prompts Tableau to group by it and redraws the visual, so the chart evolves step by step rather than being defined all at once.
- Swap chart types when the auto-choice doesn't fit 1:22
If the automatically chosen chart type isn't right — such as dates breaking down awkwardly — you can switch to a different type (like a bar chart) from the right-hand side at any point and keep building the question.
- Filter by selecting field values 2:21
You can narrow results by picking specific values from a field, such as choosing one person from a list, and the chart updates immediately — a much cleaner filtering experience than typing filter conditions.
- Now available beyond creator licences 2:40
Ask Data, including this Phrase Builder, is now available to viewer and explorer licences as well as creators, widening who can use it without needing to type questions at all.
- Auto-generated chart types won't always match what you have in mind (e.g. grouping dates by year didn't put year on the axis sensibly) — switching chart type manually fixes this.
- A lens is mandatory before you can use Ask Data at all, phrase-built or typed.
Reach for this when you or your users need to explore a dataset in Ask Data but struggle to phrase questions in free text — it's a faster, more guided way to build the same kind of exploratory chart.
How this Rollup was made provenance & method
A Rollup is drafted by AI from the video's transcript, then reviewed and edited by Tim. Everything used to produce this one is listed below (the model, the exact prompt, and the source video), so the process is transparent and reproducible.
- Transcription
- On-device: NVIDIA Parakeet v3 for recent videos, OpenAI Whisper large-v3 for earlier ones. The transcript never leaves the machine or gets published.
- Drafting
- Claude Sonnet 5 in the cloud, from that transcript.
- Prompt
- The exact Rollup prompt (v2) , the full system prompt, unedited.
- Mode
- Walkthrough: a timestamped breakdown in video order, for a demo or how-to. Written before modes existed, when every Rollup was a walkthrough.
- Source video
- Watch on YouTube
- Drafted
- 5 July 2026 at 09:38
- Reviewed & edited
- 5 July 2026 at 09:41 · by Tim Ngwena
Model + prompt + video is everything you'd need to recreate a Rollup like this yourself. The one thing we don't share is the transcript.
Rights. The video and its transcript are the property of TN Media Ltd. Unauthorised use or download is prohibited. © TN Media Ltd.