Tableau | Data visualisation | Analytics
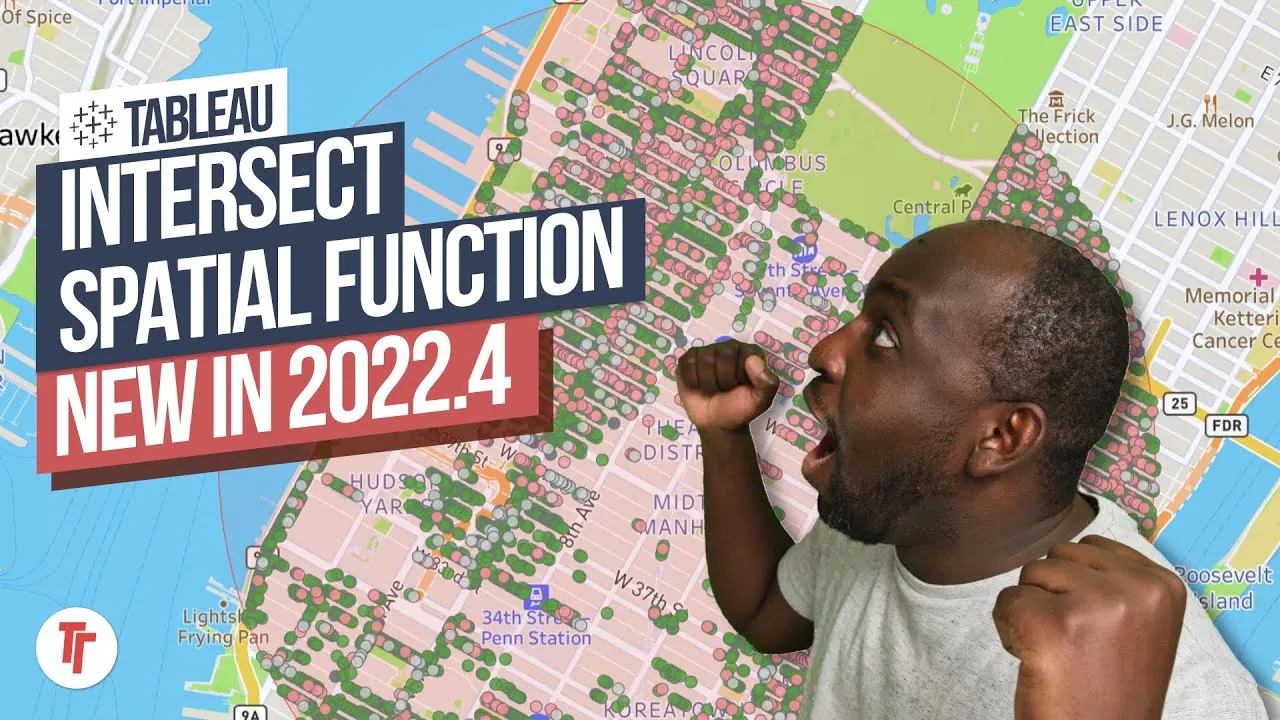
 Outline Spatial Function For Tableau | New in Tableau 2023.2
The OUTLINE function turns polygons into styleable line strings - and because it's just a function, you can layer logic on top of it.
- The OUTLINE function only works on polygons and returns line strings, so each boundary can be styled and hovered individually without the whole fill activating
- 2023.2 also adds shape type (pivoting on geometry type) and length (calculating routes and journey distances) spatial enhancements
- Shape files are zipped collections that Tableau decompresses, exposing a geometry column holding paths, points or polygons
- Because OUTLINE is a function, you can build conditional logic on top of it - for example outlining only selected regions while keeping the original polygon as a shape layer
- You can follow along with the free Mayor of London statistical GIS boundary files, and find the full functions in Tableau's spatial functions documentation
Tableau 2023.2's OUTLINE spatial function converts polygons into line strings, letting you style, hover and highlight region boundaries individually instead of the whole filled shape reacting at once.
Demoed in Tableau Public using a shape file of London borough/ward boundaries loaded via web authoring. The shape file's geometry column holds paths, points or polygons depending on what it represents.
- 2023.2 also ships shape type and length 0:00
Besides outline, 2023.2 adds shape type, which lets you pivot based on geometry type (so you can treat lines like roads differently from polygons like regions), and length, which calculates the distance of a path — useful for analysing routes, journeys or GPS traces.
- Load a shape file and inspect the geometry column 0:55
A shape file is just a zipped bundle of files; Tableau decompresses it on upload and exposes a geometry column. That column contains paths (lines, e.g. roads or rivers), points (x/y coordinates), or polygons (shapes like region boundaries) depending on the dataset.
- Visualise geometry and set the level of detail 2:12
Double-clicking the geometry field plots every shape immediately, but until you add a field (like a name) to the Detail shelf, hovering over one shape highlights all of them. Adding the relevant dimension to Detail fixes this so each shape responds independently.
- Build the OUTLINE calculation on a polygon field 2:40
Right-click the geometry field, create a calculated field, and wrap it in OUTLINE(). This only works on polygons — not lines, since lines are already lines — and returns a line string tracing just the boundary, which becomes a new spatial field you can plot on its own.
- Result: boundary-only styling and hover behaviour 3:40
Plotting the outline field instead of the polygon gives you just the boundary lines. Hovering activates only when you're over the line itself, not the interior — a genuinely different interaction model from a filled polygon.
- Layer conditional logic on top since it's just a function 4:10
Because OUTLINE behaves like any other calculation, you can wrap it in logic — for example, only outlining regions that are selected while keeping the original polygon visible underneath as a separate shape layer. Tim points to Mark Jackson's blog for worked examples of this selection-driven outlining.
- Where to find the data and documentation 5:20
The demo data comes from the Mayor of London's statistical GIS boundary files site. Tableau's spatial functions documentation covers OUTLINE and the other new functions, though Tim notes the release notes themselves were inconsistent and some links didn't resolve.
- OUTLINE only works on polygons — running it on a line/path geometry won't do anything useful since lines are already lines.
- You must put a relevant dimension on the Detail shelf or every shape will highlight together when you hover over one.
- Tableau's own release notes and in-product help links for this feature were incomplete or broken at the time of recording, so it's worth checking the dedicated spatial functions documentation page directly.
Reach for OUTLINE when you need boundary-only styling or hover behaviour on a map — for example highlighting selected regions' borders while leaving a base polygon layer for fill, rather than having the whole shape react to interaction.
How this Rollup was made provenance & method
A Rollup is drafted by AI from the video's transcript, then reviewed and edited by Tim. Everything used to produce this one is listed below (the model, the exact prompt, and the source video), so the process is transparent and reproducible.
- Transcription
- On-device: NVIDIA Parakeet v3 for recent videos, OpenAI Whisper large-v3 for earlier ones. The transcript never leaves the machine or gets published.
- Drafting
- Claude Sonnet 5 in the cloud, from that transcript.
- Prompt
- The exact Rollup prompt (v2) , the full system prompt, unedited.
- Mode
- Walkthrough: a timestamped breakdown in video order, for a demo or how-to. Written before modes existed, when every Rollup was a walkthrough.
- Source video
- Watch on YouTube
- Drafted
- 5 July 2026 at 09:38
- Reviewed & edited
- 5 July 2026 at 09:41 · by Tim Ngwena
Model + prompt + video is everything you'd need to recreate a Rollup like this yourself. The one thing we don't share is the transcript.
Rights. The video and its transcript are the property of TN Media Ltd. Unauthorised use or download is prohibited. © TN Media Ltd.