Tableau | Data visualisation
 Build Sankey Charts in Tableau Public in 30 seconds | Tableau Public Vizart Pilot
What if I told you you could draw a Sankey chart in Tableau in 20 seconds flat?
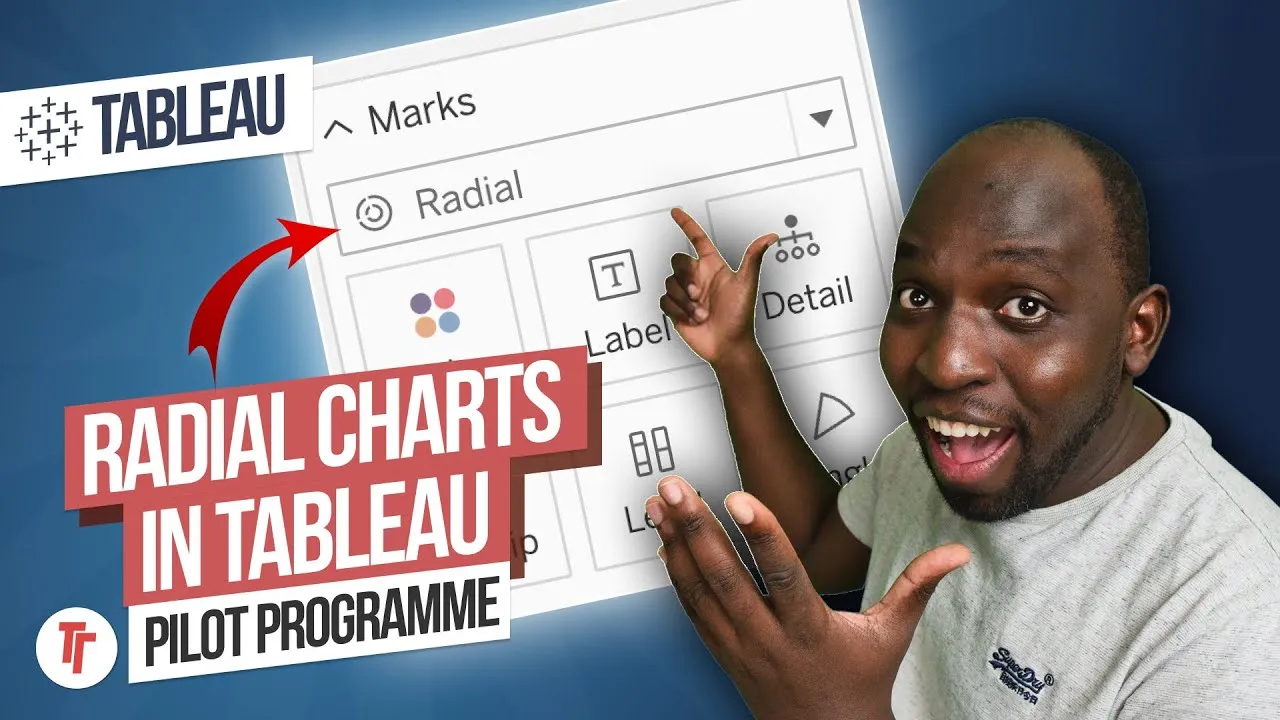
- Tableau Public's web authoring has a pilot feature, available until 30 June, that adds native Sankey and Radial chart types
- To build a Sankey, switch the marks type to Sankey, then drop dimensions (category, segment, subcategory) onto the level shelf
- Drop a measure such as quantity onto the link shelf to control the width of the flows
- The resulting Sankey is fully interactive with the usual Tableau hover tooltips, no blogs or templates required
- Native chart trials appearing in the cloud web interface likely hint at a new approach to adding chart types, which may reach Tableau Desktop
Tableau Public's web authoring has a pilot feature that lets you build a native Sankey chart in seconds, no blog workarounds or downloaded templates required.
The feature is a time-limited pilot available in Tableau Public's web authoring, shown here using Superstore Sales data connected fresh in the browser.
- Find the pilot banner in Tableau Public 0:00
Head to Tableau Public and look for a banner flagging the pilot capability, available only until the end of June, which adds Sankey and Radial chart types to web authoring.
- Connect a data source and load it 0:21
Go to Discover, then Create, choose web authoring, and connect any data source you like, not just the demo data. Drop the relevant table onto the data modelling window to get a logical table before moving to a sheet.
- Switch the marks type to Sankey 1:41
On the new sheet, change the marks type to Sankey. This unlocks two special shelves, level and link, that drive the whole chart, so this switch must happen before anything else works.
- Drop dimensions onto the level shelf 1:59
Add your dimensions (here category, then segment, then subcategory) one by one onto the level shelf. Each one you add builds out another stage of the flow automatically.
- Drop a measure onto the link shelf 2:12
Put a measure such as quantity onto the link shelf to control the width of the flows between levels. Once this is done the Sankey is essentially complete.
- Get full interactivity for free 2:32
The resulting chart behaves like any other Tableau viz, with hover tooltips and interactivity built in, despite requiring no custom blog technique or template file.
- The pilot is time-limited, available only until 30 June, so it may disappear or change afterwards.
- Sankey charts are seen by some as a controversial or less rigorous chart type in a business context, even though they're useful for showing flow between dimensions.
- This trial of native chart types appearing first in the cloud web interface, rather than Desktop, hints at how Tableau may be testing new chart additions before wider rollout.
Reach for this when you want to visualise how volume or value flows between categories (like category to segment to subcategory) without building or maintaining a custom Sankey workaround.
How this Rollup was made provenance & method
A Rollup is drafted by AI from the video's transcript, then reviewed and edited by Tim. Everything used to produce this one is listed below (the model, the exact prompt, and the source video), so the process is transparent and reproducible.
- Transcription
- On-device: NVIDIA Parakeet v3 for recent videos, OpenAI Whisper large-v3 for earlier ones. The transcript never leaves the machine or gets published.
- Drafting
- Claude Sonnet 5 in the cloud, from that transcript.
- Prompt
- The exact Rollup prompt (v2) , the full system prompt, unedited.
- Mode
- Walkthrough: a timestamped breakdown in video order, for a demo or how-to. Written before modes existed, when every Rollup was a walkthrough.
- Source video
- Watch on YouTube
- Drafted
- 4 July 2026 at 21:56
- Reviewed & edited
- 5 July 2026 at 09:41 · by Tim Ngwena
Model + prompt + video is everything you'd need to recreate a Rollup like this yourself. The one thing we don't share is the transcript.
Rights. The video and its transcript are the property of TN Media Ltd. Unauthorised use or download is prohibited. © TN Media Ltd.