0:00Hey it's Tim here, Radial Charts are now
0:02available in Tablo Public until June 30th
0:06as part of
0:06a trial.
0:07I've already covered Sankey Charts, in this
0:09video we're going to look at Radial Charts.
0:10Let's get stuck in.
0:11So here you can see the Sankey Chart I
0:13built in my previous video, it literally
0:15took 25
0:15seconds, I'll put a link to that video, but
0:17it's actually part of a trial that's going
0:19on at the moment on Tablo Public and
0:21essentially allows you to use these two
0:23chart types.
0:24So in this video I'm going to focus in on
0:26Radial Charts.
0:27Let's go ahead and we've already connected
0:29to Superstore Cells, you know that data
0:30source
0:31very well if you're familiar with Tablo, I
0:33just smacked the mic there.
0:34And then we'll go to a new sheet here and
0:37what I've done with this one is I've never
0:39done this before.
0:40I tried the Sankey one once, realised how
0:43cool it was, immediately made a video.
0:46But then here we are with the Radial Charts
0:47.
0:48So here we are with Radial Charts, I'm
0:49going to try and figure this out with you
0:50so you
0:50can kind of see maybe how future chart
0:53types might come to Tablo if you're using
0:55the sort
0:55of existing knowledge you have of the marks
0:58man.
0:58So for this one, what I'll do is I'll grab
1:00subcategory and actually I think the
1:02knowledge
1:03that matters here is the pie charts as well
1:06.
1:07So if I put subcategory there, you'll see
1:10that I get an equal proportion for each of
1:12the components of this.
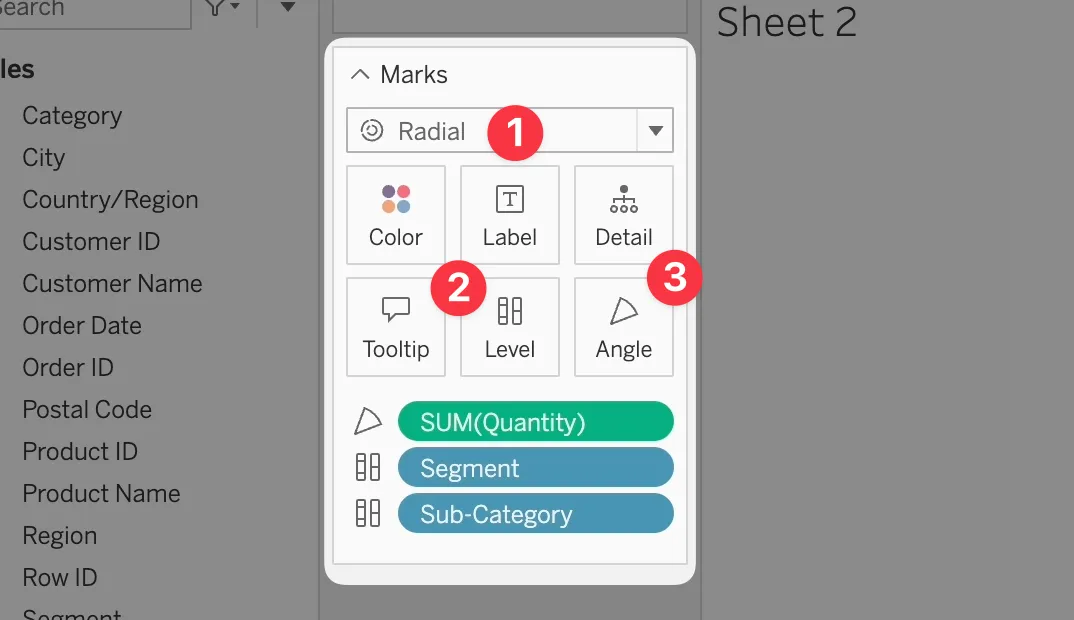
1:15And then if I add a segment onto level,
1:17then I think what should happen is you get
1:19a second
1:20level around the outside.
1:21So essentially the order of these two
1:25dictates the order of the sections.
1:29So now what I've done is I've put segment
1:32and that is now dictating the colour.
1:34So whichever comes first dictates the
1:36colour.
1:37What you could probably do is change that.
1:38But nonetheless, everything is equal
1:40because at the moment it thinks everything
1:41has equal
1:42proportion.
1:43That is not the case.
1:44So let's go ahead and put quantity, let's
1:48put quantity on angle.
1:50And you should see it starts to actually
1:51adjust this.
1:52Now the labels have gone absolutely crazy.
1:54So let's disable the labels here.
1:57And I wonder if there's any more, yeah, let
1:59's disable the bulk of labels.
2:01And then we can see here that as I click on
2:03, let's say, home office, is it going to let
2:05me click?
2:06It's not letting me click on home office.
2:07So there's clearly a bug there.
2:09But I can hover over some of these ones.
2:11I can't hover over home office.
2:13But I can, for example, click on the
2:15segment.
2:16And you can kind of carry on.
2:17You can just keep adding more and more
2:19things.
2:20And you notice that it gets smaller and
2:21smaller and smaller.
2:22So the levels you're adding sort of do
2:23matter.
2:24Now the interesting thing is you don't have
2:27the ability to control the colors of the
2:30different
2:31levels.
2:32So everything is predicated on the segment.
2:34The segment is the thing that decides what
2:36goes where.
2:37So if I drag category and replace segment,
2:40you'll see that that changes.
2:42And if I put category on color, nothing
2:44actually happened there.
2:47If I choose, for example, Seattle Grays,
2:49you'll see there is no way to drop this
2:51dimension
2:52on color.
2:53The color seems to be sort of not editable,
2:56at least in this case.
2:57So that is it.
2:58That is as simple as it is.
3:00It's essentially a pie chart.
3:01Now you could already do a two level radial
3:04shot in Tableau.
3:05It involved layering two pie charts on each
3:07other and putting them at different levels
3:08of detail.
3:10With the marks, with the map layers trick,
3:13you could do more levels by essentially
3:15putting
3:16several charts on top of each other and
3:17then having actions sort of support the
3:19interaction
3:20all the way through.
3:21But that again is a hack.
3:22You don't really want to be doing that.
3:24And so the purpose of this is actually to
3:26allow you to start to look at these in more
3:28detail.
3:30One of the things I think might be causing
3:32an issue here is this detail element here.
3:35Let me just go drag, let's say category
3:37onto detail.
3:38And when we put that on detail, does it let
3:41me?
3:41No, it doesn't let me drag.
3:43It doesn't let me select the category.
3:45So, this is going to be an interesting sort
3:47of journey because these are two radically
3:48different chart types.
3:50The Sankey was dead easy to understand.
3:52Maybe because I've seen a few Sankeys.
3:54But the radial, this is a little bit more
3:55tricky because it's not too different from
3:57a pie chart and I don't seem to have the
3:59same flexibility as I would with a pie
4:02chart
4:02to do things like labeling and coloring.
4:04But nonetheless, this is a beta until June
4:0630th.
4:07So go ahead and check it out.
4:09It's over on Tableau Public.
4:10I'll catch you in the next video.
4:11Bye.
4:12[BLANK_AUDIO]
4:22[ Silence ]