0:00Hey, it's him here. Right now I'm looking
0:02at the multi row calculations you can do in
0:05Tableau prep.
0:06In this video, I'm going to show you how it
0:07works. I'm so excited. Even look at this
0:09Tableau
0:10highlighting how the moving calculation
0:12works. I'd love this in tablet desktop. But
0:14anyway,
0:15let me show you how this works in the
0:17latest release of Tableau 23.2. I love it.
0:19Let's get
0:20stuck in. Okay, so to show you this, I've
0:22already got a flow that you can find in the
0:25description
0:25below. I've essentially put the starter
0:27file there. I set this up in such a way
0:29that we've
0:29only got three fields. This is the simplest
0:31way to show you how this works. In essence,
0:34I've got the order date, which I've conc
0:36atenated down to the month, essentially, or
0:38truncated to
0:39the month, sorry, the category, which is
0:41just three categories in the superstore
0:44data set,
0:44and the quantity. This is actually the
0:46field we're going to use for our
0:47calculation. To show you this,
0:49I'll go ahead and go to the clean step
0:50because that's where this function actually
0:52lives. You'll
0:53notice that each of the capabilities in
0:55Tableau prep fits in one of these sort of
0:57areas that I'm
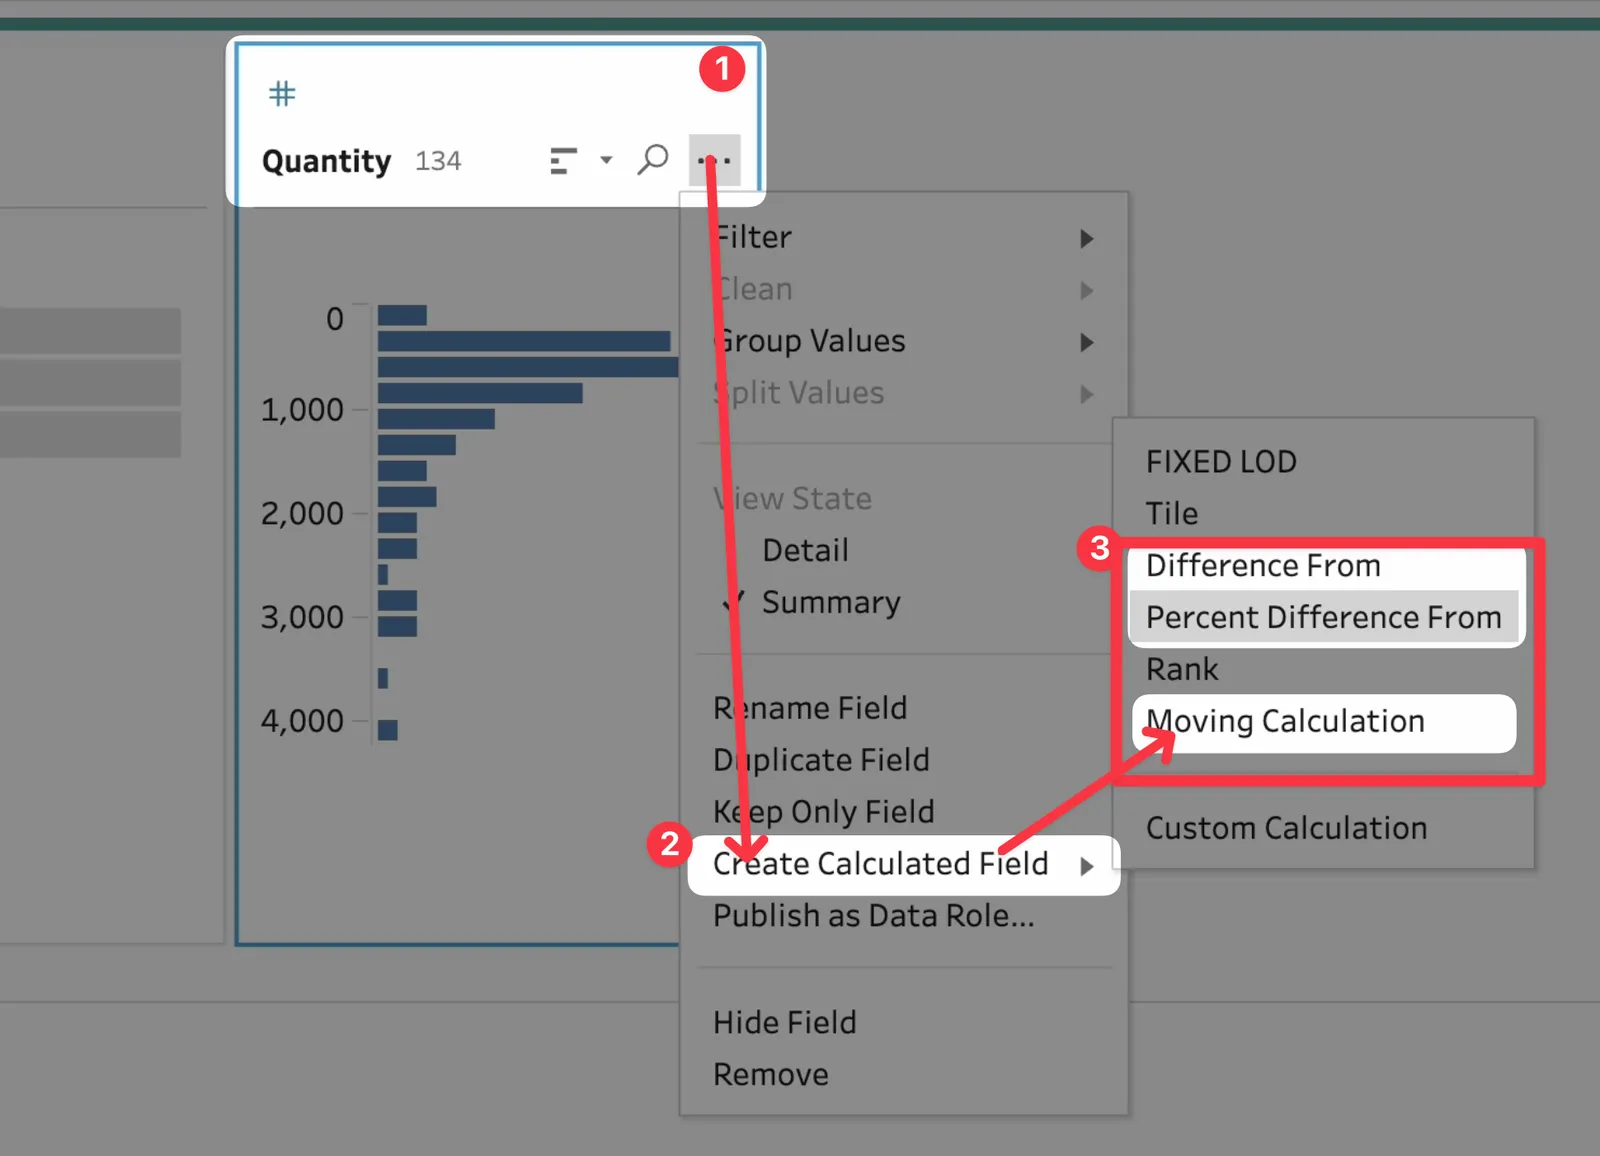
0:58hovering over here. We'll go to the
1:00quantity field. You can select it if you
1:02want to, but if you hit
1:03these three dots, you'll see that you can
1:05go ahead and create a range of custom
1:07calculations. But
1:08you'll see there's also this area at the
1:10top which has the moving calculations that
1:12we're interested
1:13in. So we've got the percent difference
1:15from moving calculation. It's technically
1:18actually
1:19multi-row calculations because in order to
1:21do those three sets of calculations, you
1:23have to
1:23be able to look across multiple rows of
1:24data. Now, this is not the first time this
1:26is possible.
1:27You could have done this in a way with LODs
1:30, and actually if you're sort of enter
1:32prising and you've
1:33been googling a little bit, it's actually
1:35been possible to do multi-row calculations.
1:37Rob Carroll
1:37here on the community pages posted a
1:39solution which used the scripting
1:41capability in order to
1:42be able to do this. I'll put this down in
1:44the description as well so you can go to it
1:46. You might
1:47be able to use this technique to do
1:48something different in your own use case.
1:50But here, what
1:51we're going to do is we're going to do a
1:52moving calculation. I think this is the
1:54easiest one to
1:55show you. So as soon as you do that, you
1:57see you get this nice new interface and
1:59essentially it
2:00creates a calculation for us. Now one thing
2:02you should know is that all of these
2:04calculations are
2:05indeed actually just calculations you can
2:07edit. You can see it creates a change here
2:09on the left
2:09hand side and that change is just
2:11essentially a calculation that's been
2:13written for us.
2:14The nice thing though, and I'm really glad
2:15Tablo have done this, is that they've
2:17created this
2:17interface that I'm highlighting in blue
2:20that allows you to configure that
2:21calculation.
2:22Previously in some of the other functions
2:24you've had to know how to structure this
2:26calculation
2:26yourself and in a way it's taken away from
2:28the magic. So I really like this interface.
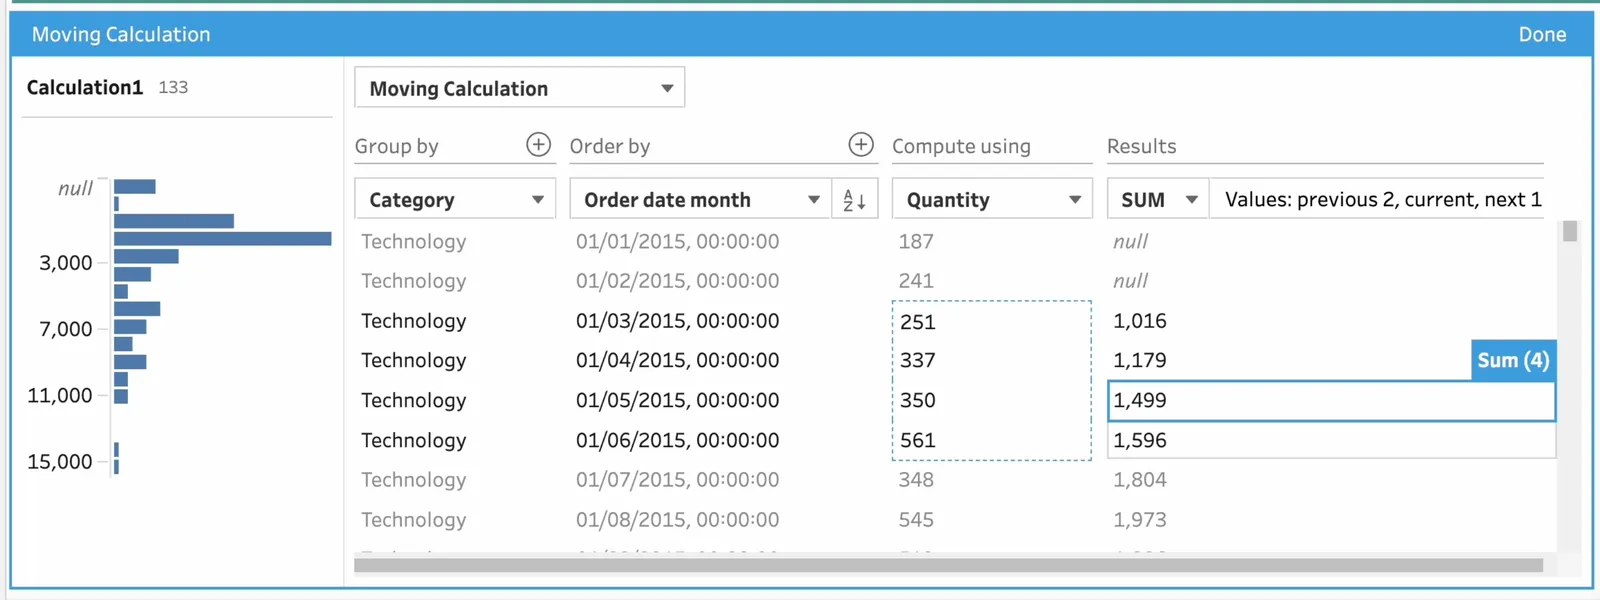
2:31So let me
2:31walk you through this interface and how it
2:33works. On the left you have the calculation
2:35that you're
2:35doing. This is going to essentially show
2:37you the summary like you see in Tablo Prep,
2:39a visual
2:39summary of the outcome. At the moment it's
2:42red because of course we haven't configured
2:44our
2:44calculation. It's expecting this field here
2:47, order by to be filled in. So let's go
2:49ahead and go from
2:50left to right until we've got this set up.
2:53So first I'm going to group my calculation
2:55using the
2:56category. So basically the way to think
2:59about this is to say that for each category
3:01I'm going to order
3:02my data using the month and there's
3:05actually a bug here where every time I
3:07click it it disappears.
3:08And the only way I've found to sort of go
3:10out and come back into this is to click it
3:12again,
3:12go in here, select the pencil and you see
3:14it opens it up again. But now you can see
3:16the calculation
3:17is working. So far we've said for each
3:20category ordered by a date month and you
3:22can see here you
3:23can see this is working in the correct
3:25order going from smallest to largest.
3:28Essentially take the
3:29quantity, so this is our quantity field, it
3:31's the only number in here and you have to
3:33do a
3:34computation. Essentially the computation is
3:36either going to be a sum in this case or an
3:38average. And
3:39there's one final touch to this which I
3:40think is quite easy to miss but it's just
3:42really important
3:43is this is actually a drop down. This
3:45little field is actually a drop down and
3:47what you can do there
3:48is you can configure how far back and how
3:50far forward the calculation looks and it
3:53assumes that
3:54you're going to include the current field.
3:57So if I say look back one it includes the
3:59current field
4:00as well which means I'm looking at two rows
4:03at the time. If I remove that then it
4:05actually means
4:06it's only looking back one row and it
4:07essentially doesn't really work. And you
4:09can kind of see that
4:10because Tableau is constantly showing you
4:12the outcome so you can kind of if I just
4:14hold the
4:14screen right here you can see that it's
4:17constantly showing you the results
4:18literally row by row.
4:20It's also showing you the visualization
4:22here and it's working because you can see
4:25that on the first
4:26row there's obviously no previous row so
4:28you get a null and that makes a lot of
4:30sense if you think
4:30about it. And how can you calculate the
4:32previous number on the first row because
4:34there is no
4:34previous number so you get a null. So let's
4:37dial this up to two and you can see that as
4:40I dial up
4:40to two now I have two nulls because the
4:42previous two rows don't exist on the first
4:45two rows and so
4:46on and so forth. Now if I tick obviously
4:48the current row then actually this makes it
4:50look at
4:51three rows. So in a way the way you set
4:54this up is all visual I don't have to know
4:56what's going on
4:57with my calculation and for the record it's
4:59changing my calculation. We'll actually go
5:02and look at that in a second but
5:03nonetheless here you can see everything's
5:05worked. Now I can also
5:06look ahead so I can tell it not just to
5:08look at the current row and the previous
5:10two rows I can
5:10also tell it to look ahead one row so now
5:12this is looking at four rows in total. So
5:15it's a bit like
5:15a window calculation in Tableau itself but
5:18you can kind of control it its extent and
5:20again Tableau
5:21is being very visual here and it's showing
5:23you those four rows here really really
5:25clearly so you
5:26can see the sort of net outcome. So as you
5:28as you sort of work your way through the
5:30data you notice
5:31that as I click on each row and there's a
5:33very subtle highlighting I'll try and
5:35highlight this
5:36in the edit you can see this box and this
5:38box is actually showing you the
5:39visualization of this
5:41moving window through your data. Now when I
5:43had to explain window calculations in Table
5:45au I literally
5:46drew this box on screen to kind of show
5:48people how the maths was working in the
5:50table. Tableau
5:51put this into the interface of Tableau Prep
5:53and I have to say Tableau we need this in
5:55desktop
5:56because this is such a much better way for
5:58people to understand what's going on with
6:00the maths. Now
6:01this is really nice because of course this
6:04is just a sum so we're basically looking at
6:06a moving sum
6:07it's adding the previous two the current
6:09row and the next one and it literally says
6:11that there it
6:12spells it out for you and so you can see
6:13the number and so as you go down through
6:15your data
6:16you can actually use this as a way of
6:17checking everything works. Now what I want
6:19to do is go down
6:20to a new category because you can see we're
6:22in a new category here where I'm clicking
6:24and you'll
6:24see that it starts again now this is
6:27interesting on the last row because I said
6:29look ahead one row
6:31it actually generates a null so if I go
6:33back in here and I remove that and I go
6:35back to my preview
6:36you'll see that on that last row the number
6:38comes back so you kind of want to be smart
6:41you kind of
6:41want to go through and really validate what
6:43's going on but again here we see that on
6:45these two rows
6:46that the data essentially tells you not
6:48enough values then it starts computing the
6:50three rows
6:51so this is a really really nice touch and
6:53let's change the calculation let's go do
6:55something
6:55different and let's see how that looks like
6:57so let's go ahead let's hit done we'll say
7:00this is
7:00a calculation actually we'll call this let
7:03me try and rename this let's click on that
7:05and call this
7:05moving sum three rows okay we'll just call
7:09that like that and we'll save that and now
7:13that's been
7:14saved now the nice thing here is we can of
7:15course go ahead and create a new one that's
7:18going to sit
7:18behind my face so let's move that out of
7:20the way let's use a difference from then we
7:22'll use
7:23percentage difference from because that
7:24will be easier to see so again we're going
7:25to have this
7:26bug I'll go ahead and I'll select group by
7:29category oh we didn't it didn't didn't do
7:32that
7:32this time I'm going to do all today oh I
7:34spoke too soon it did it again let's go
7:36back out back in
7:39click on this and we want to edit this and
7:41this will open up the interface and now you
7:44can see
7:44it's now working the great thing this time
7:47is saying difference from and we're looking
7:50at
7:50category order by the date month like we
7:52were before we can actually change this so
7:55you can
7:55say look at it backwards if that was if
7:56that was a part of your calculation and you
7:58wanted to look
7:59at things in a slightly weird way you could
8:01absolutely do that but in this particular
8:03case
8:03that's not what we want to do so again
8:06there's a little bug there you know I'm
8:08using you know
8:09tableau software right as soon as it's
8:11launched so you know this this is the
8:13authentic experience as
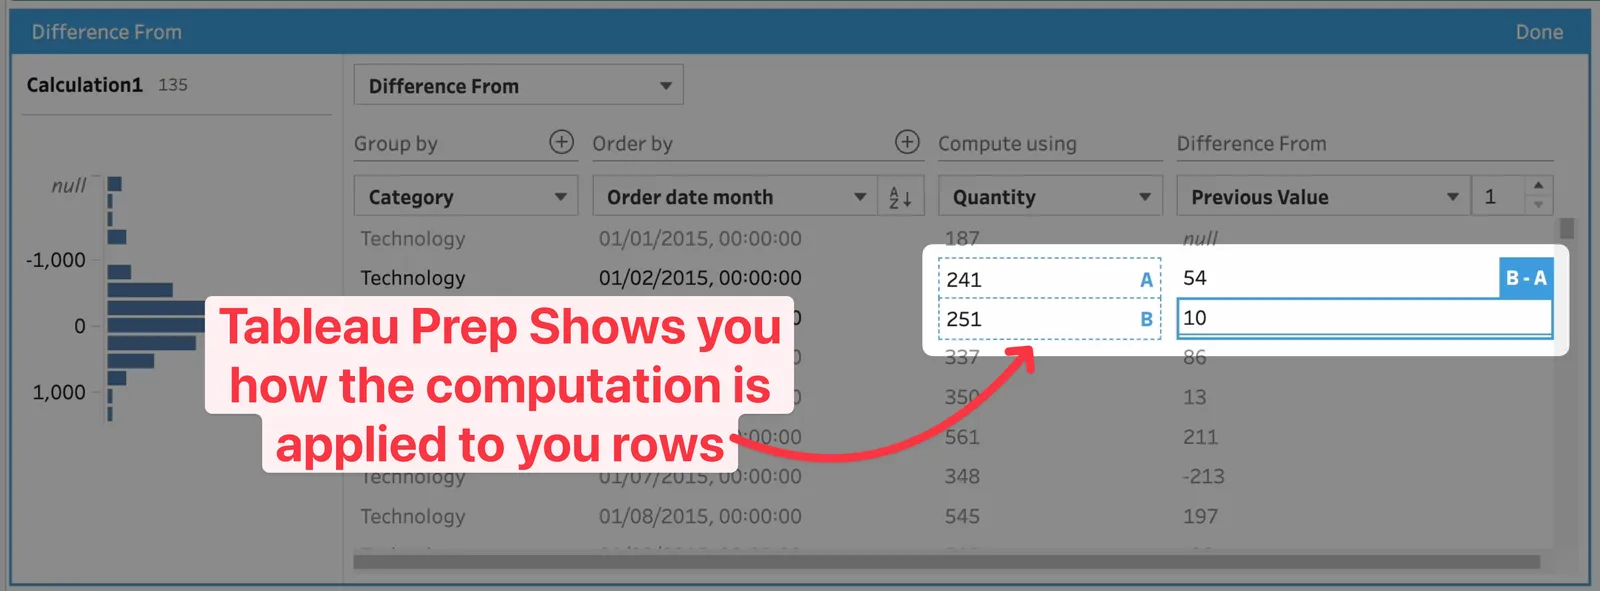
8:15it were but nonetheless let's have a look
8:17at this now so you can see that it's
8:18basically taking 241
8:20and taking away 187 to give us 54 251 minus
8:25241 equals 10 and again it's really really
8:30nice that
8:30tableau is essentially showing you the maps
8:33if I just go ahead and get my highlighter
8:36here and just
8:37sort of draw a box you'll see that it's
8:38showing you that maths really really
8:40clearly so this works
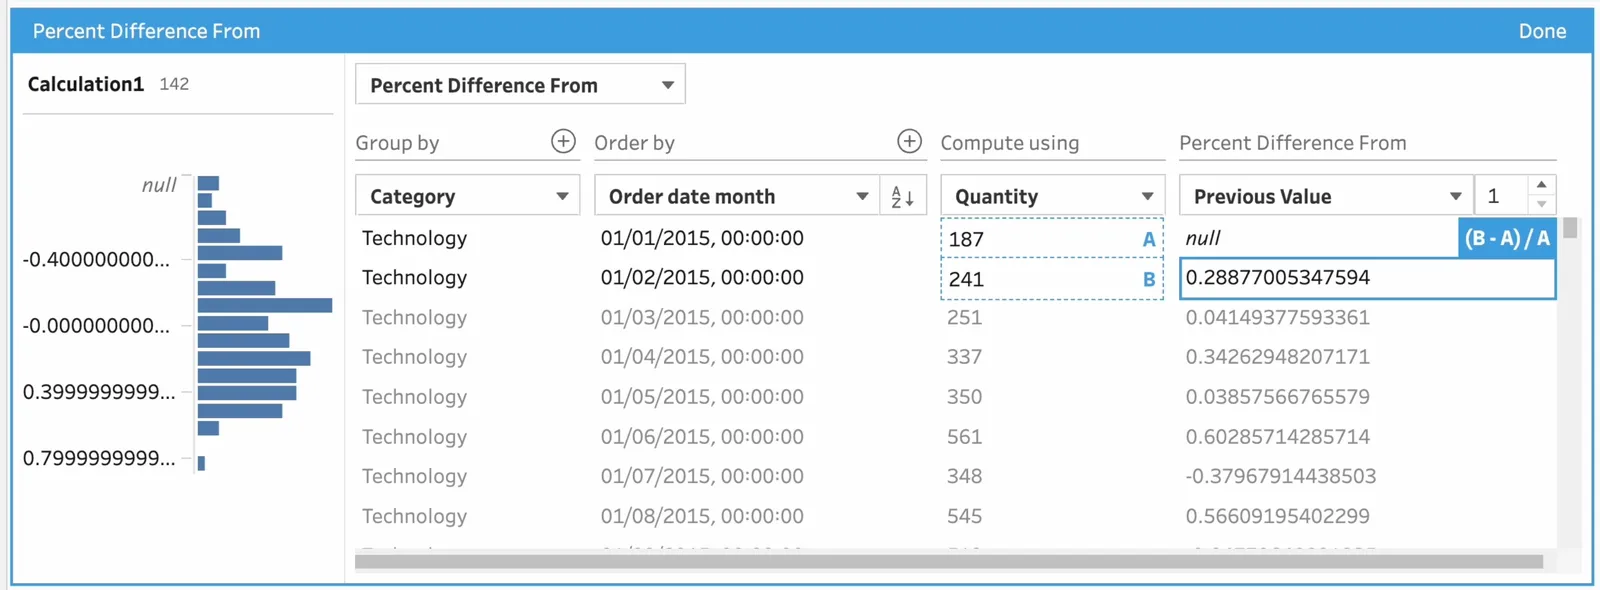
8:41exactly as you'd expect let's choose
8:43percentage difference from it will
8:45obviously go and do the
8:46maths and now you're calculating
8:48percentages percentages and you're baking
8:50that in so this
8:51is this is really nice because what you
8:52have to do is now think about how you're
8:54going to use this
8:55feature and this is actually where I think
8:58tableau prep starts to become a meaningful
9:00part of the
9:01data modeling experience in tableau and I
9:03do mean data modeling because what you're
9:05able to do here
9:06in tableau prep is essentially shape your
9:08data but what you can use that power for is
9:11to make
9:11sure you shape your data so you can use it
9:14to model your data in tableau desktop so
9:16what you
9:17might do is you might bake in moving
9:18averages moving sums differences so you're
9:20not having to
9:21do that computation in tableau in a
9:23specific chart but you can also bear in
9:26mind that in tableau you
9:27can do these calculations dynamically you
9:29can obviously do running totals as you can
9:31in any
9:32chart so in actual fact in most cases you
9:34'll want to do things dynamically inside of
9:36tableau
9:37because that's where it's going to be good
9:39to do that however with the power of the
9:41data model
9:42you've got some flexibility to be able to
9:45do these almost separate data models that
9:47answer specific
9:48questions at specific levels of detail
9:51without you having to go out and write a
9:53ton of lods or
9:54add a ton of functions especially on large
9:56data sets that could be slow so you can
9:58actually bake
9:59the data sets ready to go and if you're
10:01automating everything you're doing extract
10:03refreshes on the
10:04dashboard you're running prep flows in the
10:06background to refresh another data source
10:08in
10:08the background as long as these are all
10:10sort of synced up then you can actually
10:12create a data
10:13model that helps you answer some very
10:15nuanced specific questions in a very
10:17flexible way so
10:19don't just think of this feature as
10:21something nice in tableau prep it's going
10:23to be something you can
10:23also use to enhance the way your
10:25performance in the dashboard works but also
10:27it just gives you a
10:28bit more flexibility if you're using the
10:30data model there are some exciting things
10:31shown at
10:32conference also talked about how the data
10:34model is going to be enhanced so this is uh
10:37this sort
10:37of paired with that is going to i think be
10:39a fantastic sort of capability set for the
10:41tableau
10:42feature set now i'm going to close this
10:44down i'm going to close this window and if
10:47i go in here and
10:48edit i'm actually not able to see the
10:51calculation but if i hover over here you
10:53can see that this is
10:55the function that was written by tableau
10:57and actually in some parts of tableau this
10:59is what
11:00you'd have to write and so i think this is
11:02really interesting because i do think it's
11:04great that
11:04tableau is just like abstracting this nasty
11:08formula away from you but for the power
11:11users out there
11:13um you can of course invest a bit of time
11:14maybe format this a little bit better and
11:16you can set
11:17it up let me just try and see if i can
11:19actually uh try and see if i can edit it
11:22any other way
11:24this is the thing i don't think i can i
11:26think the only way when i hit edit here
11:29is it opens this interface i'm not actually
11:32able just to see the raw calculation and
11:35edit it myself
11:36so it's uh it's slightly interesting um
11:39there that you can see the calculation you
11:41can see the the
11:42computation the interface this is how it
11:44has to work um but that is the formula that
11:46it's writing
11:47for you so that's a super handy feature
11:49anyway that's it for this video i've sort
11:51of rambled
11:51on a little bit too much um i hope you've
11:53enjoyed this sort of explainer um if you're
11:56not yet
11:56subscribed please subscribe we're very
11:58close to 50 000 subscribers i'd love to get
12:00there very soon
12:01thanks for watching and i'll see you in the
12:03next video
12:04you
12:14[ Silence ]