Tableau | Data visualisation
 How to use the Makeline function in Tableau Desktop 2019.2 and newer
MAKELINE doesn't just join two dots, it bends to the curvature of the earth so your flight routes actually look right.
- MAKELINE() takes just two arguments, a start point and an end point separated by a comma, to draw a line between them
- With very large data sets you should narrow your data down first, as drawing millions of lines while generating points twice per record is extremely demanding on Tableau
- Use the new 2019.2 map layers, such as streets and terrain, to add context so journeys are easier to interpret
- MAKELINE respects the curvature of the earth, so long routes like flights bend to reflect the true shortest path rather than a straight line on a flat projection
- Combining MAKELINE with parameter actions lets you change the origin point dynamically and replot lines to all destinations
MAKELINE draws a line between two spatial points with a single simple calculation, and it correctly bends long routes to follow the curvature of the earth rather than plotting a flat, misleading straight line.
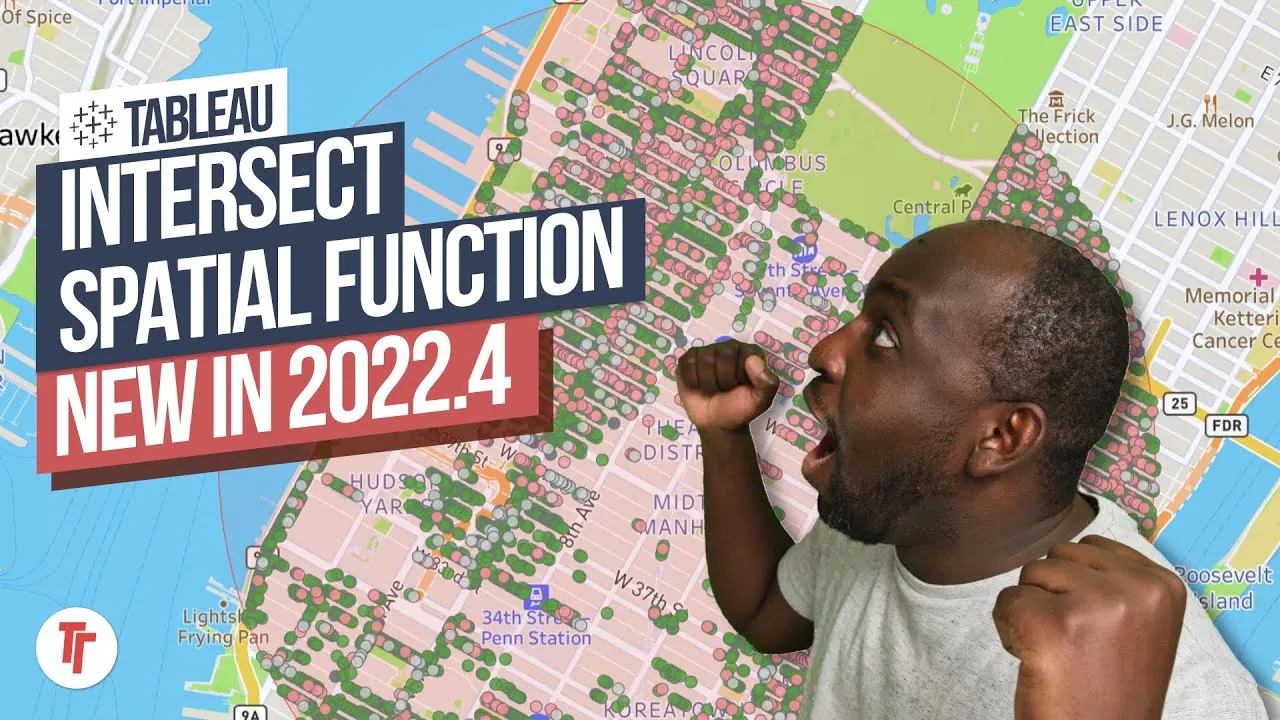
Follows on from a video on creating points with MAKEPOINT in Tableau 2019.2. Demonstrated using taxi pickup/drop-off data, then extended conceptually to flight routes.
- Write the MAKELINE calculation 0:00
Create a calculated field using MAKELINE, passing in a start point and an end point separated by a comma; if you're unsure of the syntax, the function menu on the right lists spatial functions and their arguments. You need existing point fields (e.g. built with MAKEPOINT) before this will validate.
- Narrow large data sets first 1:13
Before plotting, think about scale: generating points twice per record and then drawing a line for each is heavy processing, so filtering a multi-million-row data set down to a manageable subset (e.g. a single entity of interest) makes the build far more workable.
- Plot lines and add map layers for context 1:54
Double-click the line field to render the start-to-finish paths, then use the map layers panel to add streets, terrain and other reference layers so viewers can orient the routes within their geography. This works especially well for smaller sets of routes, such as 20-30 journeys, where individual paths stay legible.
- Understand the curvature effect on long routes 2:41
For long-distance routes like flights, a straight line on a flat map projection isn't the true shortest path; MAKELINE reflects the earth's curvature, so a route such as New York to London bows northward the way an actual flight path would.
- Combine with parameter actions for dynamic origins 3:22
As an example built by Marc Reid, pairing MAKELINE with a parameter action lets a user click a new origin point and have the visualization replot lines from that point to all destinations, turning a static route map into an interactive one.
- Recognise how extreme this gets at longer distances 4:23
The curvature effect intensifies for near-polar or highly hemispherical journeys — a Bali-to-New York route actually goes over the top of the globe rather than straight across the ocean, and similar effects show up between points like Sydney and São Paulo.
- Drawing lines across very large data sets is computationally demanding since points are generated twice per record before lines are drawn, so filter down first.
- MAKELINE only takes two arguments — start point and end point — there's no extra configuration.
- The curvature behaviour isn't a visual style choice, it reflects genuine shortest-path geography, which can look surprising until you understand why.
Reach for this when you need to visualise journeys or connections between two locations, from short local trips to long-haul flight routes, and want the paths to be geographically honest rather than flat straight lines.
How this Rollup was made provenance & method
A Rollup is drafted by AI from the video's transcript, then reviewed and edited by Tim. Everything used to produce this one is listed below (the model, the exact prompt, and the source video), so the process is transparent and reproducible.
- Transcription
- On-device: NVIDIA Parakeet v3 for recent videos, OpenAI Whisper large-v3 for earlier ones. The transcript never leaves the machine or gets published.
- Drafting
- Claude Sonnet 5 in the cloud, from that transcript.
- Prompt
- The exact Rollup prompt (v2) , the full system prompt, unedited.
- Mode
- Walkthrough: a timestamped breakdown in video order, for a demo or how-to. Written before modes existed, when every Rollup was a walkthrough.
- Source video
- Watch on YouTube
- Drafted
- 5 July 2026 at 09:38
- Reviewed & edited
- 5 July 2026 at 09:41 · by Tim Ngwena
Model + prompt + video is everything you'd need to recreate a Rollup like this yourself. The one thing we don't share is the transcript.
Rights. The video and its transcript are the property of TN Media Ltd. Unauthorised use or download is prohibited. © TN Media Ltd.