0:00Hey, it's Tim here. In today's video, I'm
0:01covering the new Google Analytics 4
0:03connector
0:04for Tableau. I've already made a video
0:06about this in the past, but it's about to
0:07be out of date. So
0:08if you've used that video, or if you use
0:10Google Analytics, and you don't know about
0:12the change
0:12coming, this is a video you need to watch.
0:14As ever, let's get started. So you might
0:16not know
0:17this, but there's a new Google Analytics
0:19property change coming about essentially
0:21every so often
0:22Google Analytics changes the way that its
0:24core underlying architecture works. And
0:27that means
0:27there's a change to the way Tableau access
0:29es that data. If you've previously come to
0:32Tableau,
0:32you've typically accessed Google Analytics
0:34by going into this list of connectors and
0:36going to
0:37the drop down and finding Google Analytics,
0:39you'll actually see I have two, the old
0:41Google Analytics
0:42connector and Google Analytics 4, which is
0:44the new connector. Now, if you don't see
0:46Google Analytics
0:474 on your machine, maybe it's not been
0:49installed for you, you can actually go and
0:51get this
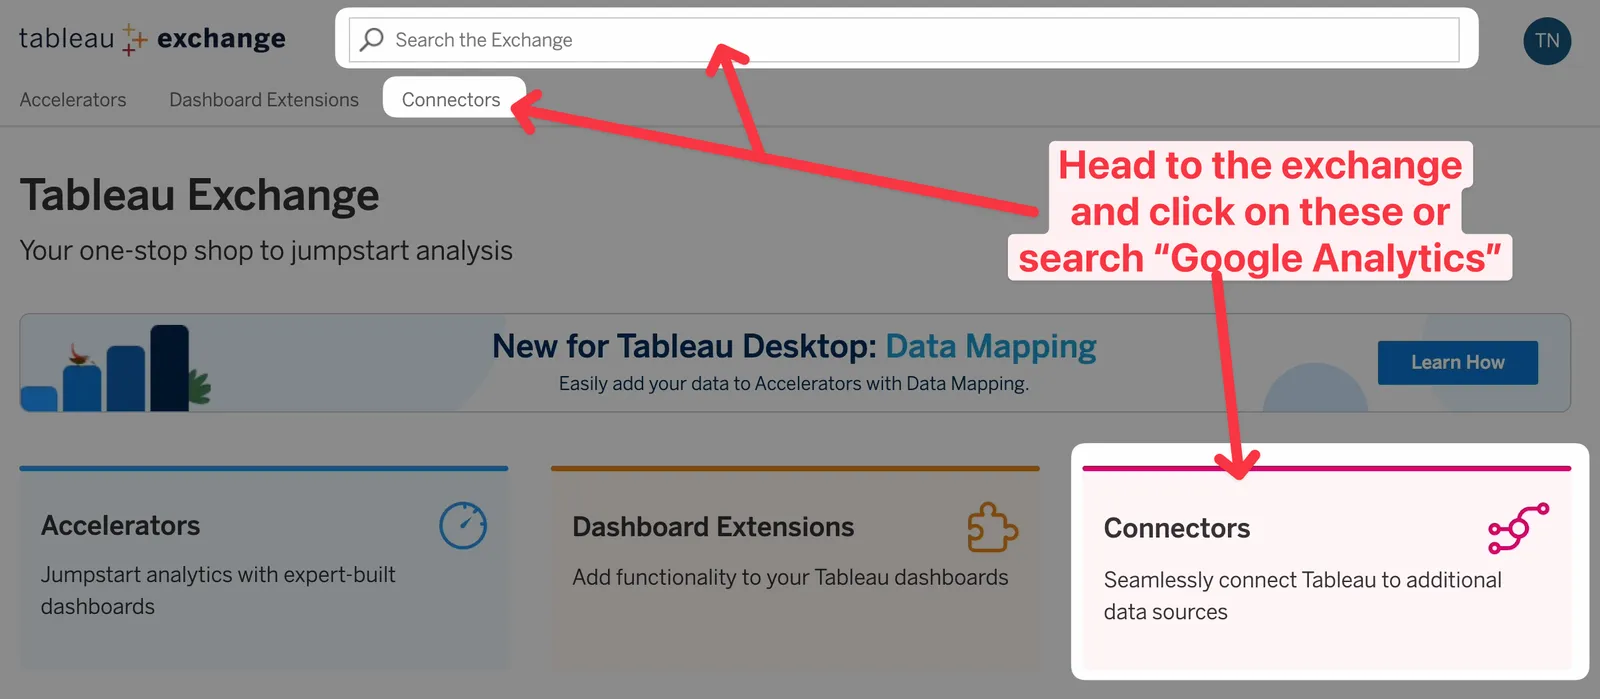
0:52connector yourself. It's super easy. Just
0:54go ahead and go to the Tableau exchange. If
0:56you don't know
0:57what the Tableau exchanges, it's
0:58essentially the marketplace for Tableau
1:00tools, you've got
1:01accelerators, which are templates, I'd wish
1:03they'd just call them that dashboard
1:05extensions, which
1:06add features to your dashboards. And then
1:07you've got connectors, which essentially
1:09allow you to
1:09connect to new data sources. If you go
1:11ahead and click on the connectors tab here,
1:13you'll see you
1:14go to this page. And this actually has a
1:16list of connectors. If I scroll down, you
1:19'll see there is
1:19actually a new one here for Google
1:21Analytics 4. If you go to that, it gives
1:23you the basic instructions,
1:25all you need to do is hit download, it will
1:27get a file and you'll put that onto your
1:29machine.
1:29Once you have that file, you're not done
1:31yet, you still have to go and put that file
1:33in a specific
1:34place. It's essentially the my Tableau
1:36repository for Tableau desktop, or Tableau
1:39prep. So I've
1:40actually got this already open here, you
1:42can see I've got the prep version open. And
1:44in each of
1:44those repository locations, if you go to
1:46the connectors folder, you'll see that I
1:48have my
1:49Google Analytics connector, and I'll do the
1:51same thing. So my Tableau repository,
1:53Google Analytics,
1:54and the thing to bear in mind here is that
1:57this connector might get updates. So I
1:59think it's also
2:00important to make sure you check this
2:02particular page to make sure you got
2:04updates on a semi
2:05frequent basis, maybe every month, just as
2:07it's new, because these are likely to get
2:09updates as
2:10bugs sort of get ironed out. So just be
2:12sure to hit that sort of link bookmark it
2:14and come back
2:15and check this periodically or if something
2:16breaks, you know where to come to find the
2:18solution. So
2:19once you've put that in the folder, it's
2:21now available as a connector. And when you
2:23go and connect
2:24to that property, let's go ahead and select
2:26Google Analytics for you'll see that Table
2:29au opens up a
2:30new window. Now what it has to do is it has
2:31to authenticate with Google. So let's go
2:34ahead and do
2:34that. I have quite a few Google accounts.
2:36So let's go ahead and hit the one that I
2:38know works with my
2:39analytics property, you do need to make
2:42sure that you have permission to access
2:44that Google Analytics
2:46property with the login you're using.
2:48Sometimes people log in with a username or
2:50access that they
2:51think has access, but it doesn't, then they
2:53can't find the property and something goes
2:54wrong. Or
2:55they have a specific username and login
2:57that you know, access the different
2:58property name, the same
2:59thing, the different number, and it gets
3:01confusing, just make sure you're using the
3:02right username and
3:03password. Go ahead, select Continue. Once
3:06you've done that Tableau will tell you, hey
3:08, you can
3:08close this window. And I had this sort of
3:10challenge because it closed. And what
3:13actually ended up
3:13happening is I went to Tableau. And I was
3:16sitting there like this. And I was like,
3:18huh, why is this
3:20taking so long. And I realized there was a
3:22window behind the Tableau window. And
3:25depending on sort
3:26of how it loaded for you, you might
3:27actually get this window in the background,
3:29you might be
3:30impatient, you might be clicking around,
3:31you might do what I've just done there,
3:32just trying to click
3:33around not even paying attention to what's
3:35going on. And you're sitting there watching
3:37this query
3:37run. And the query does sound like
3:39something's running. So a little bit of
3:41feedback to Tableau,
3:42it'd be nice if this query told you that,
3:44hey, you need to go back to this window to
3:46finish actually
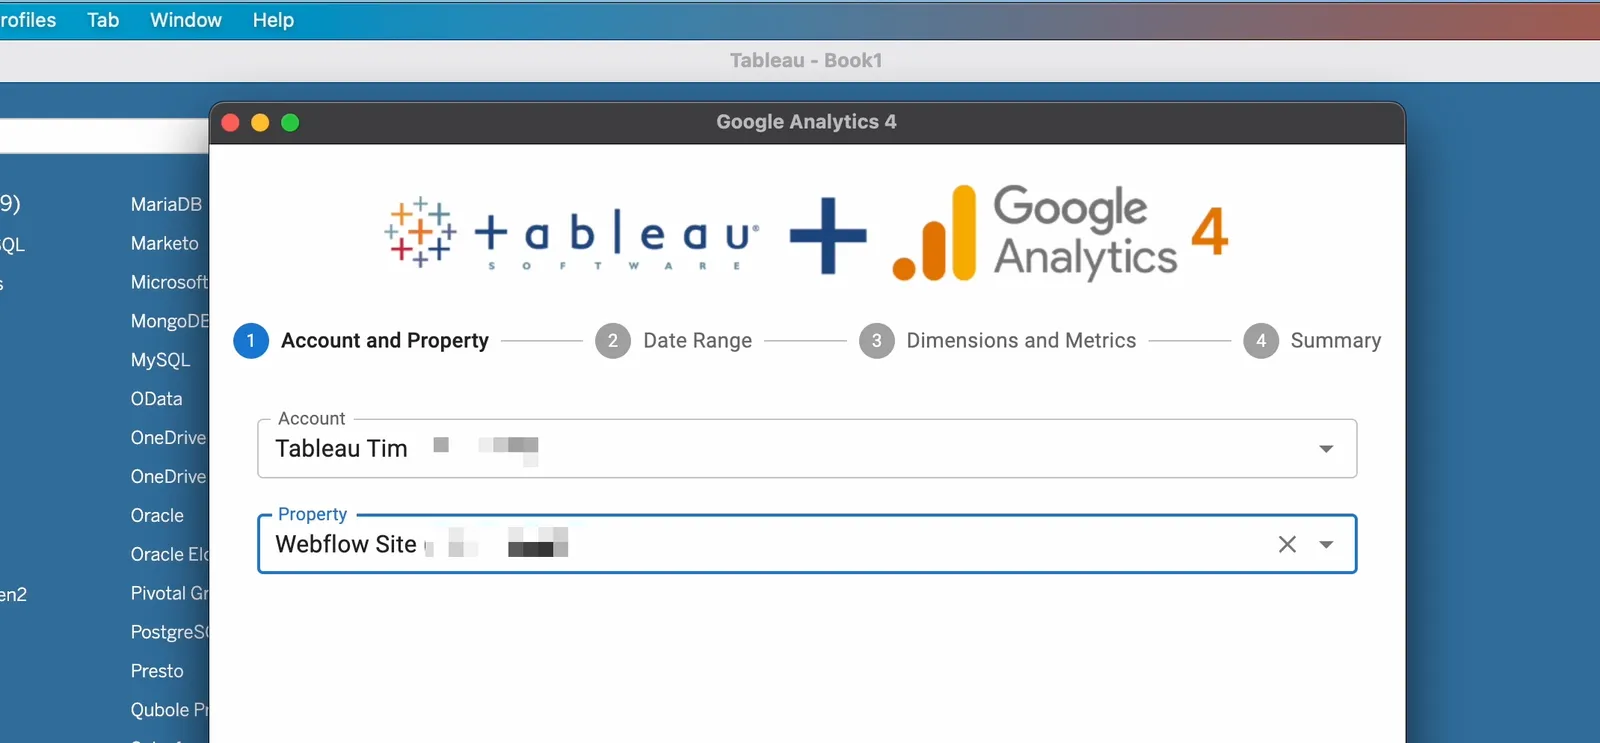
3:47setting it up. So once you're here, you'll
3:50see that you have four steps, it's super
3:52simple,
3:52you want to go to the account tab. And when
3:54you go ahead and click on this, what
3:55essentially it does
3:56is it sends a query out to Google Analytics
3:58. And it asks it for all the properties and
4:01accounts
4:01that you have in your account, you can see
4:03it's taking a bit of time to actually load
4:05the list.
4:05Again, I have quite a few, but I'm going to
4:07go to the Tableau Tim account. That is the
4:10account for
4:10my website Tableau Tim.com. And then once I
4:13've selected that account, I actually have
4:15multiple
4:16properties. And I can only see one of those
4:18properties in this particular setup with
4:21this
4:21Google account. So I'll go ahead and select
4:24the Webflow site, which is the date setup
4:26that runs my
4:27website. So you have called it such. So let
4:29's go ahead to the next step. Once you've
4:31done the first
4:32step, the next step is about selecting the
4:35range of data you want to use. And so this
4:37is actually
4:37quite a nice interface, you get a range of
4:39options, you've got some pre sort of
4:41suggested ones here at
4:42the top. But you can also dial in the start
4:44date and end date yourself, depending on
4:45how you want
4:46it to work. I'll just go for a fixed start
4:48date. Because typically, when I'm looking
4:50at Google
4:51Analytics, there's normally a fixed sort of
4:53timeframe. And you don't, you don't
4:55typically
4:55look that back that far. Normally, a lot of
4:58the analytics you're doing is on more
5:00recent
5:00performance, maybe even sometimes in the
5:02last, you know, few months, not even really
5:04years,
5:05but I'll go ahead and say beginning of last
5:07year. So this will go back to last year,
5:09and go back to January the first on that
5:11particular one. Once we've done that, you
5:13see
5:13when you click on that, it just puts that
5:15in as a start date and does a sort of field
5:17for you.
5:17And what's essentially happening the
5:19background is it's building the query that
5:20is going to use
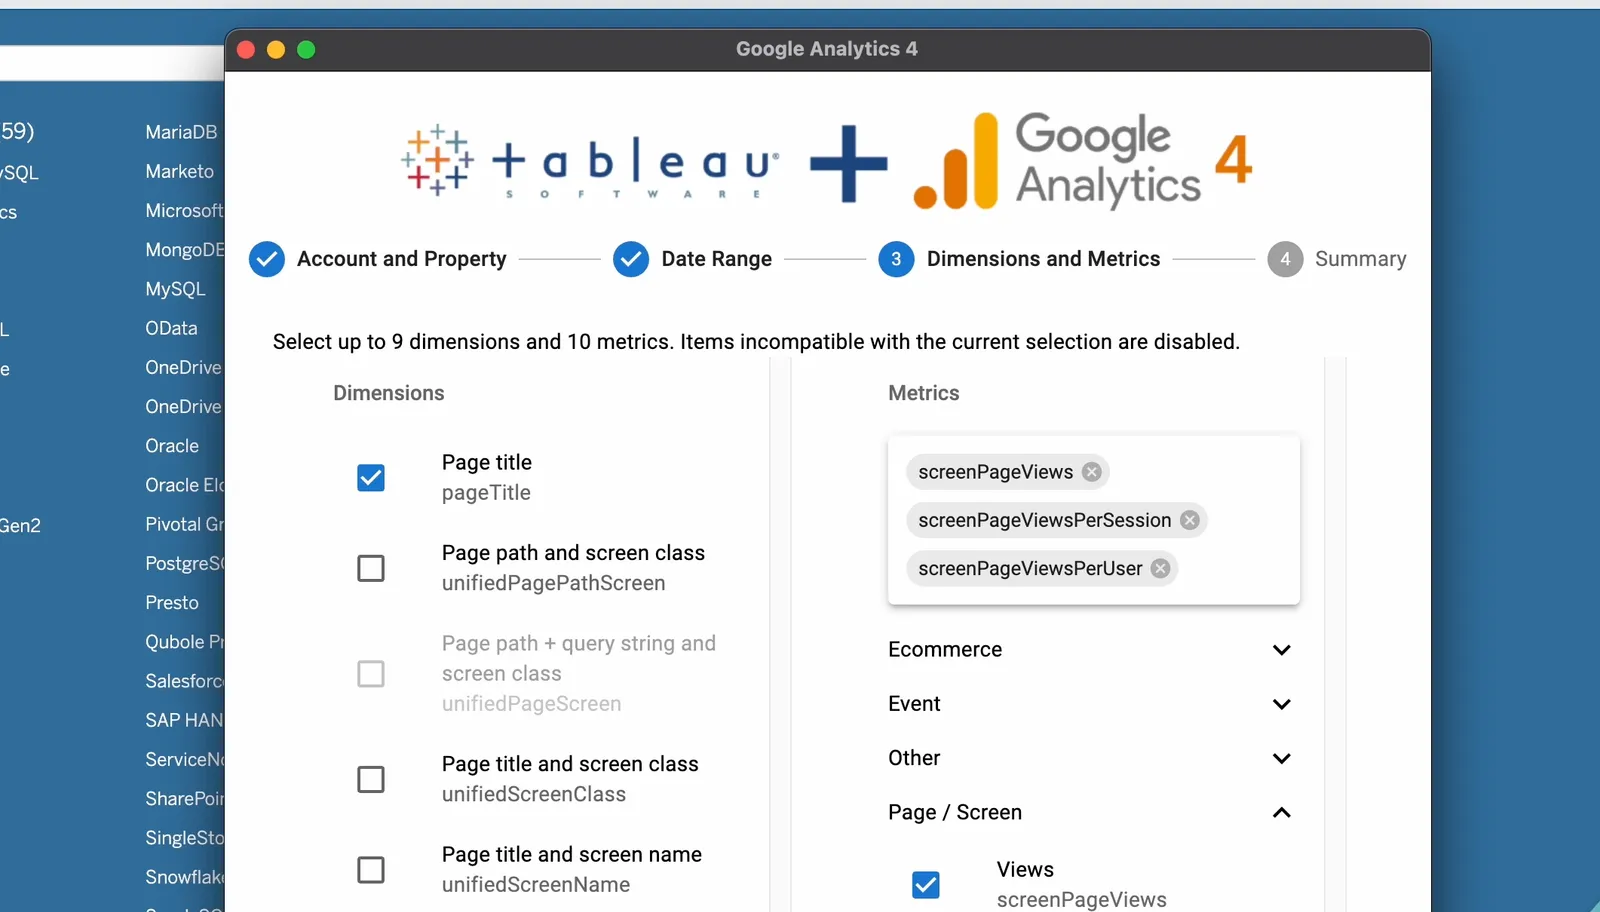
5:21for the API. And then for this next step,
5:23what it asks you to do is to choose the
5:25field. Now,
5:27this field catches so many people out
5:29because they don't realize that specific
5:32analytics properties
5:33lock out other parts of the Google
5:35Analytics setup. So as a very simple
5:37example, if I go to
5:39page slash screen, and we scroll down, and
5:42I select the full page URL, that's a very
5:45sort of sensible
5:46thing I might want to do, I might want to
5:48get the full URL of the page. But if you're
5:50not familiar
5:51with Google Analytics, you might not
5:53realize that you can see some of these have
5:54been grayed out,
5:55some of these have sort of been removed as
5:57an option, one of the things you might want
5:59to do,
6:00let's, for example, go to traffic source,
6:03as another one, you might want to bring in
6:05not the traffic source, sorry, what was I
6:07trying to do the platform device, here we
6:10go,
6:10you might want to bring in the browser.
6:12Okay, so if you go and get the full page
6:14URL, which sounds
6:15like a totally normal URL, you won't be
6:17able to get the information about the
6:19browser, because
6:20that full page URL is actually referring to
6:22something else. So if you don't know the
6:25Google
6:25Analytics for properties very well, go
6:27ahead and Google it off, you'll find links
6:30all over the
6:30internet showing you how to use it. And we
6:32're going to go ahead and uncheck that one
6:34because
6:35actually we want something a little bit
6:36more useful. So let's go ahead and uncheck
6:39that.
6:39Have to say it's a little bit sort of laggy
6:42. I think it's my Mac experience here
6:45combined with
6:46this sort of web interface. I know for a
6:48fact that Tableau doesn't support Mac OS
6:50Ventura,
6:51it's about to in 23.2. And it doesn't yet.
6:55And a new version of Mac OS is about to be
6:57announced in
6:58literally 48 hours. So just about in time.
7:01But anyway, let's go ahead and get the page
7:04path.
7:04That's actually what you want to see the
7:06different sort of part part of the URL, I
7:10'll get the page
7:10title, we won't get too many things. I just
7:12want to keep this short for the purpose of
7:14the video.
7:15We can then go ahead and get the browser.
7:17Go ahead and grab that. And you can do a
7:20bunch of
7:21different things. The only word of caution
7:23I'll say here is, as you're making
7:24selections, be
7:26be very aware of the impact it has on gran
7:28ularity. It's very nice to go and select a
7:31shopping list of
7:32everything. But you got to remember, if you
7:34go down to, if I go to date and time, and I
7:37decide to,
7:37you know, select the data at the date and
7:40hour level, that is that is a lot more rows
7:43,
7:43that's 24 more rows than I would have got
7:46if I just select the date per record. Okay,
7:48so that's
7:49something really sort of important to bear
7:51in mind. And I don't know if this is still
7:53the case
7:54with Google Analytics for but with the
7:55previous Google Analytics API, you could
7:58actually hit a
7:58limit. And at that limit, what it was doing
8:01is was sampling the whole data set. So that
8:03's something
8:04else that's pretty common with Google
8:05Analytics. Not many people know that unless
8:07you're paying for
8:08Google Analytics, it quite often samples
8:11your data. So it doesn't actually sort of
8:14give you
8:14an accurate number, what it's actually
8:16doing is it's sampling a percentage of your
8:18data,
8:19and it's making sure that that sample is a
8:21fair reflection of the actual setup. So you
8:24can have
8:25these percentages that move one or 2%,
8:27depending on when you pull the data and how
8:29you query the API.
8:30So bear bear that in mind. Anyway, let's
8:33get really get through this. I'll select
8:35the date.
8:36Let's get let's get one more thing. Let's
8:38see if what we can get about the user.
8:40Let's see, maybe not the user use the
8:42lifetime. Yeah, we can go on, let's get the
8:45first session
8:46date. That's a really that's really bold
8:48that will that will really explain our gran
8:49ularity as well,
8:50because for every unique user is going to
8:52want to know the first time they start that
8:54session.
8:55So at least if we, you know, have a month's
8:57worth of data for analyzing a really narrow
9:00window,
9:00that's actually quite helpful for figuring
9:02out what's going on with a session. So
9:04anyway,
9:04the metrics are here on the right hand side
9:08. So the classic ones are how much time
9:11people spend
9:12on the page. So I'm clicking on it, and it
9:14's not, you can see every time I click on it
9:16, it goes red.
9:17Then if I have to click the arrows, no, I
9:19can click any part of it. But you can see
9:21it was
9:22just taking a while to kind of happen.
9:24Anyway, we go views views per session views
9:26per user,
9:27you can see again, I'm clicking on this,
9:29but it's just, it's just a little bit a
9:31little bit
9:31unresponsive. So give it the benefit the
9:34doubt this is like the first release. It's
9:36whatever
9:37version it is 1.0 something. And then we'll
9:40go ahead and select Next. And now we have
9:44essentially
9:45our setup. So we've got the property, we've
9:46got the date range, you've got the start
9:48date,
9:48the dimensions and metrics. Bear in mind
9:50what I said there about that information.
9:52So let's go
9:53ahead and hit Connect. And at this point,
9:55this is when the API actually goes out and
9:57does a request
9:58for us based on these metrics. And you can
10:00see it's pretty fast. It's already back
10:01with the data.
10:03A few things to bear in mind here. This is
10:05an extract, you can't connect to it live,
10:08because essentially, it's an API request.
10:11And API requests have to sort of, you know,
10:13call home,
10:14get the data and come back. And so the only
10:16way Tableau can store that data is to store
10:18it as
10:18an extract. It can't keep asking that data
10:21and keep updating it. That's not sort of
10:23the way the
10:23setup of the API is work. But if you're
10:26using a technology such as five channel,
10:30whatever other
10:31technology you might be using, typically
10:32there, what people are doing is they're
10:34piping this data
10:35into the database, then querying their
10:38database and querying that live. And tools
10:40like five,
10:41try and have the ability to sort of
10:43schedule this capability. I actually use
10:45five try myself,
10:46my Google Analytics, it pushes data to Snow
10:48flake, and I connect to that data in Snow
10:50flake. So
10:50five, try and take care of all the hard
10:53work of setting up all these API
10:54connections and
10:55making sure it's up today, I get the data
10:57in my database where I can work with it
10:59however I want.
11:00And I know that every 15 to 20 minutes is
11:02getting updated by five trends. So that's
11:04essentially how
11:05I how I run that. But if you're using Table
11:07au want to connect directly to the data
11:09source,
11:09this is a pretty good way of doing it. So
11:11now we have our data. The other thing you
11:14can do is add
11:15multiple connections, you might sort of
11:16want to build a data model here, it doesn't
11:18appear that
11:19that's possible. But what you can do is you
11:21can add a second connection. So if you go
11:24up to data,
11:24and here you say new data source, it will
11:26actually create a new data source here. So
11:29you'll essentially
11:29have two data sources you can use. And then
11:31once in Tableau, you can blend them. So you
11:34can
11:34essentially create a field that is common
11:36between the two. And then you can use them
11:38to blend that's
11:38useful if you're downloading what I would
11:41say two very distinct data sets, maybe one
11:43is about
11:44traffic's journey and you know how our page
11:47is doing. And another one is about a
11:50specific
11:51campaign. And all you want to do is maybe
11:53match up the behaviors on a specific day or
11:56match up
11:56the behaviors for a specific country. The
11:59thing that's common is that one field or
12:01two fields,
12:02but everything else is actually completely
12:04separate different levels of granularity
12:05that
12:06works as well. So a blend can work in that
12:08setup to help you kind of achieve some some
12:10some
12:10interesting results. But nonetheless, as
12:12soon as obviously you've connected to your
12:13data, it's an
12:14extract. So once you go over to the sheet,
12:17you can actually now start using various
12:19things. So if I go
12:20ahead and grab the page title, and we go
12:23ahead and look at screen page views, let's
12:26go ahead and do
12:27that. And let's sort this out, we can see
12:30that the most viewed page on my website
12:33here is, thank God
12:35the homepage. So you can see that that's
12:38had at least in the last two years 7707.
12:41Now these are
12:42this is small frying compared to like
12:44actual websites, this is very, very low
12:46numbers. But
12:48if I was being smart about this, what I
12:50would do is I wouldn't just go look at the
12:52web page. I'd go to the other pages. So the
12:55tutorials, how I've made a particular video
12:58,
12:58I think this one is tablets in blog posts,
13:01column reordering enhancements in Tableau
13:0322.2.
13:04So something I'm trying to do is give
13:07people an alternative way to watch my
13:09videos. I've got some
13:10exciting news about that. Stay tuned. But
13:14nonetheless, yeah, this is basically what
13:17is being
13:18viewed. And so we've got low view numbers
13:20here. But again, YouTube is typically the
13:22way that most
13:22people watch my content. So I'm not too bum
13:24med out about this. But nonetheless, there
13:26you go, we've
13:27got Google Analytics for working super
13:29simple, super easy. I've tried to add in a
13:31lot of context
13:32as much as I possibly can based on my
13:34experience. But again, if you need to do
13:36this in a serious,
13:37reliable way, you might choose to pipe your
13:40data first into a database, then from there
13:43,
13:43you can work with it in your standard ways.
13:45And there are tools like five time that can
13:47do that
13:48for you for Google Analytics, I think it's
13:50actually quite cheap on something like five
13:52time, there are cheaper ways of doing it as
13:54well. And but nonetheless, I think it's,
13:57you know,
13:57workable, I use it myself as a content
13:59creator. That's sort of how cheap it is. I
14:02can afford to
14:02sort of run that and then query as and when
14:04. But anyway, that's pretty much it for this
14:06video.
14:06Thanks for watching. And I'll catch you in
14:08the next video.
14:09Transcribed by https://otter.ai
14:10Transcribed by https://otter.ai
14:20[ Silence ]