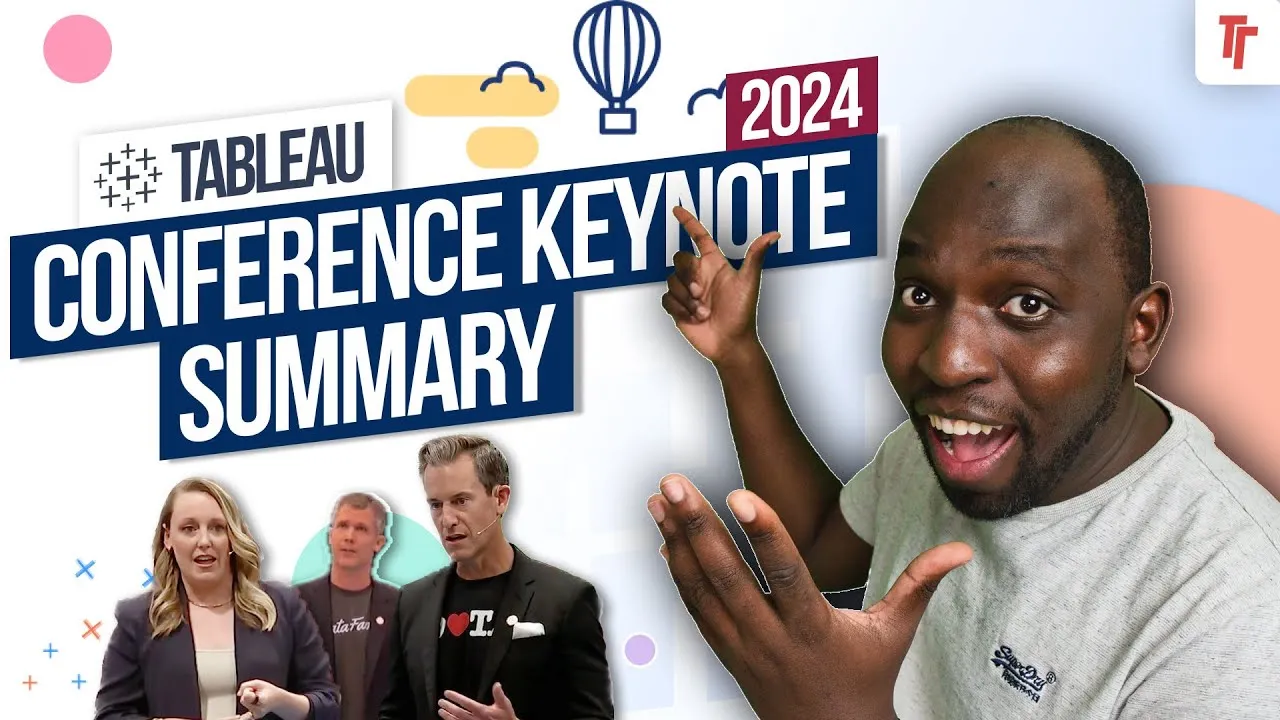
0:00Hey, I've just finished watching the
0:01keynote for a second time. I'm going to try
0:03and round it up in
0:04under 20 minutes. This is your keynote
0:06roundup. Let's get stuck in. Now I've got
0:08timestamps below.
0:09So if you want to jump ahead straight to a
0:11new feature, those are all marked in the
0:13timestamp
0:13below. So you can check those out. But I'll
0:15start off with a high level overview of
0:17what the keynote
0:18was like. The keynote was essentially two
0:20things. It was the main keynote we're used
0:22to and devs on
0:23stage in one session. Typically, we're used
0:25to having these two separately. But
0:27actually,
0:27if you go way back when to previous
0:29conferences, there used to be one event.
0:32Now this could be for
0:32a couple of reasons. It could be that it's
0:34only been a few months since the last
0:35keynote just a
0:36few months ago, because the conference was
0:38pushed forward to May. And therefore we've
0:40had a little
0:41less time for some of these features to
0:42bake in the oven. But nonetheless, that was
0:44sort of the
0:45overall high level split of the conference.
0:47Now in the first half, we had Mark Nelson
0:48essentially
0:49leading the charge opening the keynote,
0:51along with Andy Cottgrieve, who kind of
0:53warmed up the crowd
0:54and got the energy levels going. But then
0:57we had three customers who essentially came
0:59on to support
1:00some of the core messages and sprinkled
1:03into that we had some features announced,
1:05we had the
1:06rebranding of Tableau online to Tableau
1:08Cloud. And then we also had some
1:10capabilities around data
1:11storytelling that were revealed a little
1:14bit more. After that, the main gist of the
1:16features was
1:17essentially developed through the devs on
1:19stage section. And in there, we got a whole
1:21sort of
1:22quickfire round of features that I'm going
1:23to go through now in a little bit more
1:25detail.
1:25But let's actually start from the top. Let
1:27's start with the very beginning of the
1:29keynote. Now,
1:29if we start from the top, Mark Nelson
1:31essentially started by talking of a concept
1:33called the data
1:34gap. Essentially this problem where data
1:37leaders want the data skills of their
1:40employees to be
1:41much further along than they actually are.
1:43And essentially how Tableau can help bridge
1:46that gap
1:46by making analytics available to basically
1:49everywhere for everyone. That was the exact
1:52phrase he used. And then he sort of moved
1:55on to drawing parallels to how this vision
1:58is sort of
1:59shared by Salesforce. It was a very sort of
2:01smooth operator way of getting people into
2:03a pitch about
2:05how Salesforce and Tableau have a sense of
2:07shared values. And he essentially used four
2:09key points to
2:09highlight that. The first one was community
2:12, touching on the fact that Tableau has a 1
2:15million
2:16strong community and Salesforce has a 16
2:18million strong trailblazer community. It's
2:21kind of
2:21interesting because he talked about them as
2:23if they were separate products, but
2:25actually they
2:26are separate products, but they're now part
2:28of the same company. And that was sort of
2:30the thing that
2:30was interesting. He kind of didn't go as
2:32far as to say, "Hey, we're all part of the
2:34same family now."
2:35But that was sort of implied by the way the
2:37conference was set up, the stage, the
2:39characters,
2:40everything about this felt very Salesforce.
2:42So that was sort of implied. And the next
2:44point was
2:44technologies, talking about the excellence
2:47in technology that both companies have had
2:49in the
2:49past, Salesforce in the CRM world and Table
2:52au in the analytics space. And the idea that
2:54by
2:55bringing these two things together, you
2:57essentially have the opportunity to unlock
2:59a whole world of
3:00data because Tableau is an analytics
3:01platform, allow you to go and connect lots
3:03of disparate
3:04data sources together and get insights from
3:06them. And Salesforce on the other hand has
3:08done a good
3:08job of building a world-class customer-
3:11focused CRM platform, but there's a lot of
3:14unearth data
3:15that's not being used in there. And of
3:17course, these two together will help sort
3:19of open up
3:19that world to more people. And that's sort
3:22of the general idea that he was trying to
3:24push there.
3:24The next thing was on values. And
3:26essentially here, he talked about the idea
3:28that Salesforce
3:30and Tableau have actually had a sense of
3:32shared values when it comes to making sure
3:35that people
3:35have access to data, whether it's two
3:37things like the Tableau Foundation or the
3:39Salesforce
3:40grants that Salesforce have been doing all
3:42along. And actually these two things are
3:43sort of very
3:44similar initiatives in real terms. And Mark
3:46was drawing these concepts together to make
3:48it really
3:49abundantly clear. There's actually a lot
3:51more to both companies than maybe the Table
3:53au community
3:54is sort of familiar with. And the last one
3:56was product potential. The idea that if you
3:57bring
3:58these two behemoths of their respective
4:00spaces together, there's so much more
4:02potential available.
4:03He used the idea of peanut butter and
4:05chocolate. I actually don't think that's a
4:07great combination,
4:07in my opinion, but nonetheless, he said it
4:10would be even better if you put those two
4:11things together.
4:12And so that was essentially, I think, a
4:14very strong Salesforce page. I think there
4:16is a
4:17good amount of sentiment in the Tableau
4:19community at the moment that Salesforce
4:22branding and
4:23marketing is being sort of pushed into the
4:26Tableau world without much value coming
4:30from
4:30the Salesforce world to show us what Sales
4:32force can offer Tableau. And it goes vice
4:34versa as well.
4:35We'll maybe do a separate video on that.
4:36But nonetheless, that was sort of the key
4:38message.
4:38Hey, look, Salesforce and Tableau, two very
4:41similar companies, two very similar ethos,
4:43two very similar cultures coming together
4:45to create something amazing. That was sort
4:47of the
4:47key message. We then moved on to the next
4:49phase of the keynote, which was essentially
4:51looking at
4:52three separate customers. Now I'll start at
4:54the top by showing you who these customers
4:55are.
4:56It was JetBlue, Standard Chartered and Feed
4:58America. These were the three organizations
5:00and actually three very different
5:02organizations to have on stage, all telling
5:04their own stories
5:05about how Tableau has enabled them to go
5:07forward. Let's start first with JetBlue.
5:10JetBlue was,
5:11in a way, a really good example for Tableau
5:13to showcase something they believe in,
5:15which is
5:15the power of the cloud. And in this
5:17particular section, JetBlue was here to
5:19talk about this
5:20concept of moving faster with analytics
5:23technology. And the key driving part of
5:26Tableau that enables
5:27you to do this is Tableau Online. The idea
5:28that you can take a product and essentially
5:30,
5:30without much sort of setup work, you can
5:33have an infrastructure built out available
5:35through
5:35your organization done very, very quickly
5:37and in a very agile way. Now, this was then
5:40used to help
5:41rebrand Tableau Online to the Tableau cloud
5:44. Now that's a very small change, but I
5:47think it's an
5:47important one to try and get people
5:49familiar with the difference between Table
5:51au Server, which is the
5:52on-premise offering, and Tableau Cloud,
5:54which is what I'm going to call it now,
5:56which is the cloud
5:57offering from Tableau with a fully managed
5:59solution that then also enables a bunch of
6:01other
6:01technologies to come and follow on from it.
6:04This then broke off into a little bit of a
6:06feature
6:07sort of run through. So the great thing
6:09about this with now Tableau Cloud being
6:10sort of showcased,
6:11they showcase this amazing opportunity to
6:14have region-specific sites for Tableau
6:17Cloud. I keep
6:18trying to say Tableau Online, but
6:19nonetheless, region-specific sites for
6:21Tableau Cloud. That's
6:22two features. First of all, you can create
6:24sites for each and every Tableau Cloud
6:26instance. And
6:27then secondly, you can make them region-
6:29specific, maybe necessarily for compliance,
6:32but also for
6:32performance. Let's just imagine you're an
6:34organization who's spread across multiple
6:36parts of the world. You might have
6:38compliance or geographical restrictions
6:40that mean you have
6:41to have different Tableau servers in
6:43different locations. And through Tableau
6:45Online and managed
6:45sites, you can essentially have this
6:47capability out of the box. This is a really
6:49big feature,
6:50and it's something that a lot of people ask
6:51for. I can see the Tableau Server fans out
6:53there
6:54starting to look at this with lots of envy.
6:56We're not clear if this will come to Table
6:58au Server at
6:59all. I doubt it will because this is again
7:01being done by Tableau, but it would be good
7:03to see the
7:04technology doing this come out in some way
7:06or form where Tableau Server admins can
7:08sort of enable this
7:09and work with it, even if it means working
7:12with AWS or Microsoft Azure in order to do
7:15that.
7:15We then got a few small things, things like
7:18customer-managed encryption keys for
7:20extract.
7:21And then also we got a hint of what seems
7:23to be another add-on, but I think this is
7:25actually just
7:26a rebranding of an existing add-on. I'm not
7:28entirely sure on this, so don't quote me on
7:30this,
7:30but I think the Server Management add-on is
7:33just being rebranded to the Advanced
7:34Management add-on
7:36so that it can too serve Tableau Online,
7:39now Tableau Cloud, as well as Tableau
7:41Server. I
7:41think that's what's going on here. And so
7:43some of this stuff will come through that
7:45capability for
7:46customers who really want sort of the full
7:48capability of Tableau. They'll need to get
7:50this
7:50server add-on in order to get these
7:52features specifically on Tableau Cloud. The
7:55other small
7:55thing was Admin Insights, essentially
7:57getting a little bit of an improvement. Now
7:59, Admin Insights
8:00for Tableau Online, now Tableau Cloud, have
8:02actually been around for a little while,
8:03but
8:04they didn't come on by default and they're
8:06quite basic. Now I think what's going to
8:08happen is you're
8:09going to get slightly better sets of data,
8:12maybe even longer periods of time for the
8:14amount of
8:15history that those data sources have, but
8:18also access to more data sources and pre-
8:20built workbooks
8:21as well that you can use alongside your
8:23Tableau Online instance. And then that was
8:25sort of the end
8:26of the JetBlue segment. That was sort of
8:27the end of this whole section. They were
8:29essentially using
8:30customers to showcase specific features,
8:32which was, I think, a nice touch because it
8:34drew parallels
8:34to these companies. Now this then creates a
8:36new problem because the next customer didn
8:39't really
8:39have any product feature behind it. And I
8:41think this is why maybe this particular
8:43customer stood
8:44out as not being very convincing when it
8:46came to the keynote. I'm not saying
8:48anything whatsoever
8:49about the actual content of the keynote
8:51here. All I'm just saying is that it was
8:53very hard to draw
8:55any sort of learning from the keynote to
8:57understand why that customer, what that
8:59customer has done
9:00that's different from many other
9:02organizations to make them a standout
9:04example in the keynote.
9:06And so the example was standard chartered
9:07bank. And essentially here we're talking
9:09about a data
9:10culture and the idea that you can use the
9:12opportunity of training people up with data
9:15to make your workforce happier, stick
9:18around more often, but more importantly,
9:20enable a data culture.
9:21And essentially the individual that was
9:23just on stage talking about this just
9:25basically talked
9:26about how Tableau has helped them do this
9:27and how they've created a center of
9:29excellence,
9:29essentially around this philosophy to help
9:32galvanize its culture and community to go
9:34from
9:34a 400 strong server all the way up to 10,
9:37000 in a very, very short amount of time. A
9:40story that's
9:40played out actually in quite a few
9:42organizations, but it's very, very hard to
9:44replicate. And
9:46something called the Tableau blueprint is
9:47sort of designed to help you figure this
9:49out. But nonetheless
9:51this was just an example of a customer
9:52talking about how that has helped them go
9:54forward.
9:55We didn't have enough tangible examples or
9:57features to really sit behind this either.
10:00And we didn't have anything new. Maybe
10:01something got pulled from the keynote for
10:03this particular
10:03customer. Who knows? After standard chart
10:05ered, we had a sort of a change of energy.
10:07It was sort
10:08of the halfway mark and Francois, the chief
10:10product officer came on stage and actually
10:12just stepped
10:13out of the keynote a little bit and
10:14reminded us all about the nostalgia, about
10:16how Tableau became
10:18the product that it is. It was this sort of
10:20a small innovative product that came out of
10:22the
10:23basement of analytics and brought analytics
10:25to the stage as he said. And what was
10:27really good about
10:28this is that I think this keynote really
10:31needed this at this time. We just had a
10:33very, let's just
10:34say we just had a lot more content sort of
10:37pitching us on the philosophy of various
10:39aspects of Tableau,
10:40things that we've heard before. And apart
10:43from the Tableau Online to Tableau Cloud re
10:45brand and the
10:46feature set there, there wasn't really much
10:47in the keynote at this point. So Francois
10:49came on stage,
10:50reminded us all about why we love Tableau,
10:52why the community has come, and then
10:55started to pin this
10:55to a customer story that also landed really
10:57, really well. The Feed America story was
10:59actually
11:00really powerful. It's not a very
11:01complicated one. It's not a sophisticated
11:03story. It's just a simple
11:04story about how a company or organization,
11:07and not for profit in this case, has a
11:09mission to help
11:10make sure that people have access to food
11:12and that they use data to help solve that
11:14problem.
11:15It's a story that gets played out many,
11:17many times. Except for here, they were
11:19drawing parallels to
11:20the impact it has on people, communities,
11:22and how Tableau has enabled their
11:24organizations and their
11:26partners through collaborations with people
11:28like the Tableau Foundation to push that
11:30philosophy
11:31forward. And so that was a really, really
11:33good customer story. It landed really well
11:35with me.
11:35Maybe it's just me. Let me know what you
11:37think in the comments. But nonetheless,
11:39this drew a really,
11:39really nice thread because Francois then
11:41came on stage and said, "Well, this is
11:43great. We have
11:44people using data to tell the story, but
11:46there's even more people in every business
11:48that can't
11:49work at the level that authors like myself
11:51work at." In essence, not everyone is data-
11:55driven,
11:56to borrow the phrase. Not everyone is
11:58excited by data. So how can we help the
12:00people who
12:00can't build these stories easily, aren't
12:02familiar with these, or maybe don't have
12:04the data literacy
12:05but shouldn't be excluded from the
12:06narrative? And that's where a new feature
12:08was introduced
12:09called Data Stories. Now, Data Stories is a
12:12really interesting announcement because it
12:14's essentially
12:15the product that's come out of an
12:16acquisition, a previous acquisition from
12:18Tableau around a
12:20thing they're commonly called narrative
12:21science. If that's wrong, let me know in
12:23the comments.
12:24But essentially, this technology looks at
12:26your workbook and essentially builds a
12:28story just
12:29purely using text. And this works like an
12:31extension. The interesting thing is a lot
12:33of
12:33the features today are actually extensions
12:35of Tableau. They'll be in the Tableau
12:37economy in
12:37the extension gallery. But nonetheless, it
12:39was an interesting feature because Tableau
12:41pitching this
12:42as a way to bridge that gap, as Mark set
12:44out to talk about at the very beginning.
12:46How do you get
12:47those people who might never build
12:48something but need to know what's going on
12:51in a dashboard,
12:52and maybe just can't pull out the insights?
12:53People who can't necessarily browse or
12:56engage with an
12:57analytical dashboard or anything like that,
12:59don't even know where to start. This was
13:01giving a
13:01narrative sort of story alongside the
13:04visualization. And out of the gate, it's
13:06got a pretty strong
13:07feature set. It works on mobile, it
13:09actually supports accessibility guidelines
13:11as well,
13:11not just because it's built with
13:13accessibility in mind, allowing you to
13:15customize how it works and
13:16how it looks. But also, if you think about
13:18it, for people with visual impairment, it's
13:20actually going
13:20to be a really nice add on because it's
13:21just a browser extension. Essentially
13:23inside of the
13:24dashboard, screen readers should be able to
13:26read the text from it as well, making dash
13:28boards a
13:29little bit easier to understand. And I
13:31think that might become the primary mode
13:33for people who are
13:34visually impaired to listen and understand
13:36what's going on inside of a dashboard
13:38without necessarily
13:39having to look at it. So I don't know if
13:41that's 100%, I'm pretty sure that that is
13:43something that
13:44the team thought about. But nonetheless, we
13:46'll have to wait till the feature comes out
13:47to fully
13:48validate that. But data stories was a
13:50really nice feature. Now, I'm not 100%
13:53convinced, I'm never
13:54convinced by features like this, because
13:56what always happens is you want to tweak
13:58them a little
13:58bit, you want to sort of change how it
14:00works. And they did show some capabilities
14:02around dynamism,
14:03so the ability to change things like
14:05filters and have the text update. But we're
14:07going to need to
14:08see this in real life, we're going to need
14:10to see this working. And also, we're going
14:11to need more
14:12details about whether this is actually
14:14going to be part of an add on or not, in
14:15order to really sort
14:16of understand how wide and how far this
14:19feature is going to go. The last part of
14:21this was data
14:22science or business science, which is what
14:25Tableau has essentially branded Einstein
14:27Analytics,
14:28a part of Salesforce that was brought over
14:30to the Tableau product family, and hasn't
14:32really found
14:32its space in the Tableau community, at
14:34least, and it's definitely something that's
14:35used in the
14:36Salesforce world. But again, it's not
14:37something that I'm familiar with. And it's
14:39not something
14:40that a lot of people in the Tableau
14:41community are familiar with. But it looks
14:44like Tableau sort of
14:45recognize this. And what they seem to have
14:47done is they've managed to rebrand the
14:49model building
14:50capabilities that existed in Einstein into
14:53a bit more of a Tableau skin and put it
14:55natively inside
14:56of Tableau. Now, I think there is a catch
14:57with this, I think you're going to have to
14:59have this
15:00only run on Tableau Cloud, because it's
15:02still using the general intelligence that
15:05Salesforce use
15:06to run 150 billion predictions, apparently,
15:09every single day. So that's going to be an
15:12interesting
15:12little tweak. The details here are going to
15:14be super interesting. How is this working?
15:16Is it coaching people appropriately to work
15:18through the data? Because otherwise, you
15:20just
15:20sort of going through model building by
15:22just clicking things. Is the model building
15:24advanced
15:26enough to be really trustworthy? Does it
15:27have enough flexibility to make the people
15:29who do
15:30build models on a day to day basis, happy
15:32with the way that this works, so they can
15:34fully move their
15:35workflow into this setup? It's not entirely
15:37clear. So again, it's one of those things
15:39we'll have to
15:39wait and see. But it was here on the
15:41keynote. And therefore, I think it's
15:42something we're going to
15:43see very soon. Tableau is pretty keen to
15:45bring it in. I'm sure Salesforce want to
15:47bring it in.
15:48And so we're definitely going to see it
15:49very soon, hopefully this year, if not
15:51early next.
15:51Okay, after this section, it basically
15:54turned into Devs on stage. So this to me
15:57was the second
15:57half of the keynote. And then we just
16:00basically got a feature showcase after
16:02feature showcase,
16:03just coming out of pretty much the stage,
16:06it was just awesome to see some of these
16:08features that
16:09we've got to see. So let's just go right
16:11from the top. The first one is shared
16:13dimensions for the
16:14data model. Now, this is not something
16:16radically new in the analytic space. It's
16:18actually a pretty
16:19common feature in other products, Power BI,
16:21and not to mention, but this is now going
16:23to be possible
16:24in Tableau soon, we didn't get an exact
16:26release date, I believe this will probably
16:28come not not in
16:30the next release 2022.2, but probably three
16:33or four, maybe the beginning of next year.
16:36But
16:36nonetheless, it's there and it's working.
16:38It's a simple idea. And that is that a
16:40dimension in the
16:41data model can essentially link to other
16:43dimensions in other logical levels. So it's
16:47as simple as that.
16:48But what this means is you don't have to
16:50build complicated models anymore, because
16:52previously,
16:53you could only have one shared dimension
16:55between two logical tables, because you can
16:57have multiple
16:58dimensions, essentially sharing against
17:00multiple logical tables. And it's going to
17:02be a lot easier
17:03to build data model and make comparisons
17:05that would have been previously a little
17:07bit more
17:08tricky. But as ever, I think this is
17:10something you have to see because we've
17:11been so used to joins
17:13and unions in Tableau that's something like
17:15this, I've just seen people struggle with
17:17the data model
17:18in general. And something even like the
17:20bookstore example that Tableau use is easy
17:23to understand,
17:24because the analogy is easy to understand.
17:26But as soon as you have to apply it to your
17:27data,
17:27people tend to struggle. So I'm going to be
17:29interested to see how Tableau themselves
17:31showcases feature when it actually comes
17:33out. We're going to have a real challenge
17:34trying to
17:35make videos about it here on the channel as
17:37well. So look out for that. The next one
17:39was the web
17:40data connector 3.0. Now this was actually
17:42announced at Trailblazer DX. If you haven't
17:44caught that, go check it out on Salesforce
17:46Plus. Yes, I'm pitching a Salesforce
17:48product. But
17:48nonetheless, and this is actually cool
17:50because it enables a couple of things the
17:53ability to run
17:53connectors locally, rather than having to
17:56have them hosted somewhere on the internet.
17:58And this
17:58essentially means that from a security
18:00perspective, it's a lot easier to get
18:02connectors through the
18:04door. The other thing is easier to build
18:06connectors because of this new SD. And then
18:08lastly, Tableau
18:09talked about the capability of having
18:11something called table extensions,
18:14essentially extensions
18:15that run at the connection level. So the
18:17demo they showed was you connecting to a
18:20data on Twitter
18:21using a web data 3.0 connector, and then
18:24wanting to do sentiment analysis, but not
18:26wanting to do
18:27that inside of the dashboard, actually
18:29wanting to do it at the data level as it
18:31comes in. And so
18:32they opened up essentially a table
18:34extension that allowed you to run Python on
18:36the data. So as the
18:37data gets added in, as it gets refreshed,
18:40the model runs on this particular data
18:42source. And then you
18:43can do the sentiment analysis straight away
18:45inside of Tableau without having to run TAP
18:47I or anything
18:48like that. Be interesting to see how this
18:49actually works in practice, it's not clear
18:51if this is only
18:52going to work for Tableau Online, I think
18:54this will work in most places. And for
18:55Tableau Online,
18:56there'll be probably a managed instance of
18:59Python running somewhere. So be interesting
19:02to see how
19:02this actually works in earnest. But
19:04nonetheless, this is a nice thing to see,
19:06especially for the
19:07data scientists out there who already do a
19:09lot of modeling outside of Tableau, and
19:11then have to sort
19:12of figure out how to blend that with their
19:13Tableau data, whether it's through tools
19:15like Altrix,
19:16or having sort of Python scripts run inside
19:18of Tableau prep, whatever you use, it's
19:21always been
19:21a little bit constant. So now you can do it
19:23at the connection level. Now the next
19:25feature absolutely
19:26blew my mind multi row calculations in
19:29Tableau prep. Now this is like the one use
19:33case that I
19:34think this is so important for is moving
19:37averages and running totals in Tableau prep
19:40, something you
19:41have to do so frequently, it's actually a
19:42very basic thing, you wouldn't think you
19:44need to do
19:44it so frequently. But actually, it's super
19:46important. Let's say you need to do the
19:48running
19:48total over a period of time. And maybe you
19:50want to track when something passes a
19:52target, but you
19:53want to build that into the data source
19:55rather than having it be dynamically done
19:57inside of
19:58Tableau. So then you can compute against
20:00that to avoid doing LODs, which then cause
20:02a performance
20:02issue. That's a very sort of long winded
20:04example. But nonetheless, it's something
20:06that's so easy to
20:07do in other tools like Altrix, as quite
20:09easy to do in SQL, if you know how, but in
20:12Tableau prep,
20:13you have to sort of jump through various
20:14hoops to get it to work. And even then it's
20:16still quite
20:17sort of, you know, constrained, you have to
20:19go out to excel, or you have to go to your
20:21data source and
20:22do a bit of sort of scaffolding to set it
20:25all up no more. And what I really like
20:27about this feature
20:28is that it looks like they've also taken
20:30the time to make it work really nicely, not
20:32just sort of
20:33here's the feature we've done, they've made
20:35it work the way the rest of Tableau prep
20:36works. So
20:37you have a lot of visibility of what's
20:39going on, you get a nice preview. But also
20:41you've got the
20:41ability to do things like add row numbers
20:44to things and fill rows as well. So that's
20:47something
20:47really, really nice and nice little feature
20:49add on from what we got in the past where
20:50you can fill
20:51dates and fill numerical rows. So that's
20:53really, really good to see here. And this
20:55is, this is
20:56going to unlock so much more potential in
20:56Tableau prep. I even tweeted a response to
20:56Jaira Flores to
21:00this to this effect. But yeah, be cool to
21:03see this actually working. And hopefully we
21:05get it later
21:06this year. I can't wait to get my hands on
21:08it. We then moved on to our state of phrase
21:10builder. This
21:11is actually something that was released in
21:1322.1. But this was essentially just
21:16reminding us about
21:17this feature, but more importantly, also
21:20hinting the capability coming soon, which
21:21is going to allow
21:22you to suggest phrases. So not only do we
21:25have the ability to help you build phrases,
21:27but they're
21:27actually going to use machine learning to
21:29look at the previous phrases that have been
21:31run to suggest
21:32possible phrases for you to use. And that
21:34again, will be coming later in the year.
21:37Now, the last two
21:37features that were covered absolute heavy
21:40hitters. The first one is a feature that I
21:42've actually, you
21:43know, seen in the flesh before today, which
21:45is called the data orientation tool. This
21:48is going to
21:48be such an impactful feature, not only
21:50because I think it's actually going to help
21:52people who don't
21:53necessarily build visualizations, but it
21:56will also help authors absolutely helps
21:58everyone. This is
21:59essentially a feature that allows you to
22:01add a little bit of guidance as to how a
22:03dashboard works,
22:04but also shows users how interactions work
22:07without the users necessarily having to
22:10build those
22:10features in or the authors having to build
22:12those features in. But it does it in a
22:13standardized way.
22:14So you can actually train your users to
22:16look at this feature in a standardized way.
22:18And whichever
22:19workbook or dashboard they use, they'll
22:20also be getting some context about the
22:22fields being used,
22:23how the calculations have been done, but
22:25even have links to videos where people can
22:28give demos
22:28of how to use the dashboard. Super, super
22:30useful. I hope this is just version one, I
22:32hope we get to
22:33see more of this feature coming out over
22:35the next few months as well, and releases
22:38as well. And then
22:39the second feature was a really interesting
22:41one. This is essentially image roles for
22:43your data,
22:43the ability to say, look, this column
22:46represents links, and these links actually
22:49link out to images
22:50and then use those images in the data pane
22:52natively, without having to do any hacks or
22:54use
22:54extensions in order to do that. Super
22:56simple, should have been in the product
22:58years ago, but
22:59has only just arrived. And that was
23:01essentially what ended the keynote. Great
23:03note to end it on,
23:04I think people really appreciate something
23:06like that. I can't wait to see what people
23:07do on tablet
23:08public with this. It's going to open up
23:10lots of possibilities, especially for fast
23:12moving consumer
23:12goods, where product images, and product
23:15colors and product, you know, just being
23:17literally being
23:18able to see the product in the context of
23:20the data visualization is going to hugely
23:23help people,
23:24and even things like car parts, even things
23:26like inventory management, that's all going
23:29to be a lot
23:29better. And if you can add on other
23:31extensions as well, and it's going to
23:32really help things sort of
23:34work. I really like it because essentially
23:36allows you to do even cooler things like
23:38hacks, for
23:38example, you could even add QR codes to
23:41those images, you could have a web service
23:43dynamically
23:44or procedurally creating these QR codes.
23:46And there's those QR codes can then do
23:48something
23:48else in another application, there's just
23:50so much more being opened up by that
23:52particular feature.
23:53So I can't wait to see what people do with
23:55that. And it's going to be super fantastic,
23:56especially
23:57have a service that dynamically create
23:59those images based on, you know, some input
24:01from a data
24:02source or whatever. So that would be really
24:04, really cool to see, hopefully in the near
24:05future. But that
24:06was it. That was all the features. That was
24:08everything that was covered in the keynote.
24:10And I think it was absolutely fantastic.
24:12The very end was just a call out some of
24:13the other sessions
24:14that were at the keynote. Now, if you've
24:16made it to the end of this video, thank you
24:17so much. Thank
24:18you for staying and watching this summary.
24:20Please let me know in the comments what you
24:22found
24:23interesting at keynote. If you didn't watch
24:24the keynote, well, great. Hopefully, this
24:26roundup has
24:27helped you. But actually later today, when
24:29this video should come out on time, I'll be
24:31doing a
24:32live stream of the iron vs contest. And if
24:34you haven't already check out my live
24:36stream of the
24:37keynotes two hours long with Andre, we
24:39covered everything we got comments, we had
24:41over 300 people
24:43commenting during the entire live stream.
24:45We even had friends who are watching the
24:47live stream whilst
24:48he was waiting to go into the keynote. So
24:50go and check out the live streams really,
24:52really fun
24:53thing to watch. And you can see what other
24:55people think about the keynote as it went
24:57on. Thanks for
24:57watching this video. Thanks for making it
24:59to the end. Be sure to check out the other
25:01live stream
25:01sessions that we went throughout the week
25:03of conference if you're watching this much,
25:05much further into the future. But
25:07nonetheless, thanks for watching and I'll
25:09catch you in the next video.
 Tableau | Data visualisation | Industry trends | Tool strategy